Take 5 Report

Adopt physical AI to unlock latent value in critical operations

This HFS Take 5 report, written in partnership with Hitachi Digital Services, is for business and technology leaders in mobility, industrial equipment, and energy and utilities evaluating physical AI adoption to unlock value in critical operations.

Executive summary

HFS Research defines physical AI as software-led services embodied in physical systems that perceive, decide, and act in the real world, operate autonomously, and are delivered and monetized as productized services.

Enterprises are turning to physical AI to unlock latent value in their most critical operations, the areas where prevailing digital technologies have so far fallen short, not because those technologies were immature, but because they lacked the functionality and cost profile to act in the physical world, where operations are physical and touch many interconnected systems. The IoT and 5G boom a decade ago sensed operating conditions in real time but could not act on them. Physical AI closes that loop, adding autonomous action and prediction.

A study conducted in partnership with Hitachi Digital Services surveyed 105 business leaders operating in the US across mobility, industrial equipment, and energy and utilities to map how they are adopting physical AI, including the drivers, expected outcomes, critical use cases, challenges, and spend patterns. More than half of them expect their enterprises to operate at conditional autonomy or higher within two years, up from roughly a quarter today. This is a clear signal that adoption is moving from experiment to operational reality.

The survey uncovered five key takeaways:
  • Physical AI is deployed where legacy tech was lacking, with 43% of enterprises running connected fleets in mobility.
  • Businesses fund what pays back fast. Cost reduction tops the list at 28%, followed by productivity and talent.
  • Enterprises are taking a pragmatic adoption roadmap, as augmented autonomy becomes the norm at 39% within 24 months.
  • A strong business case, not technology maturity, gates adoption. Twenty-two percent of enterprises cite high upfront cost as the top challenge.
  • Business leaders are optimistic about doubling physical AI spend, using a hybrid approach involving multiple vendors.
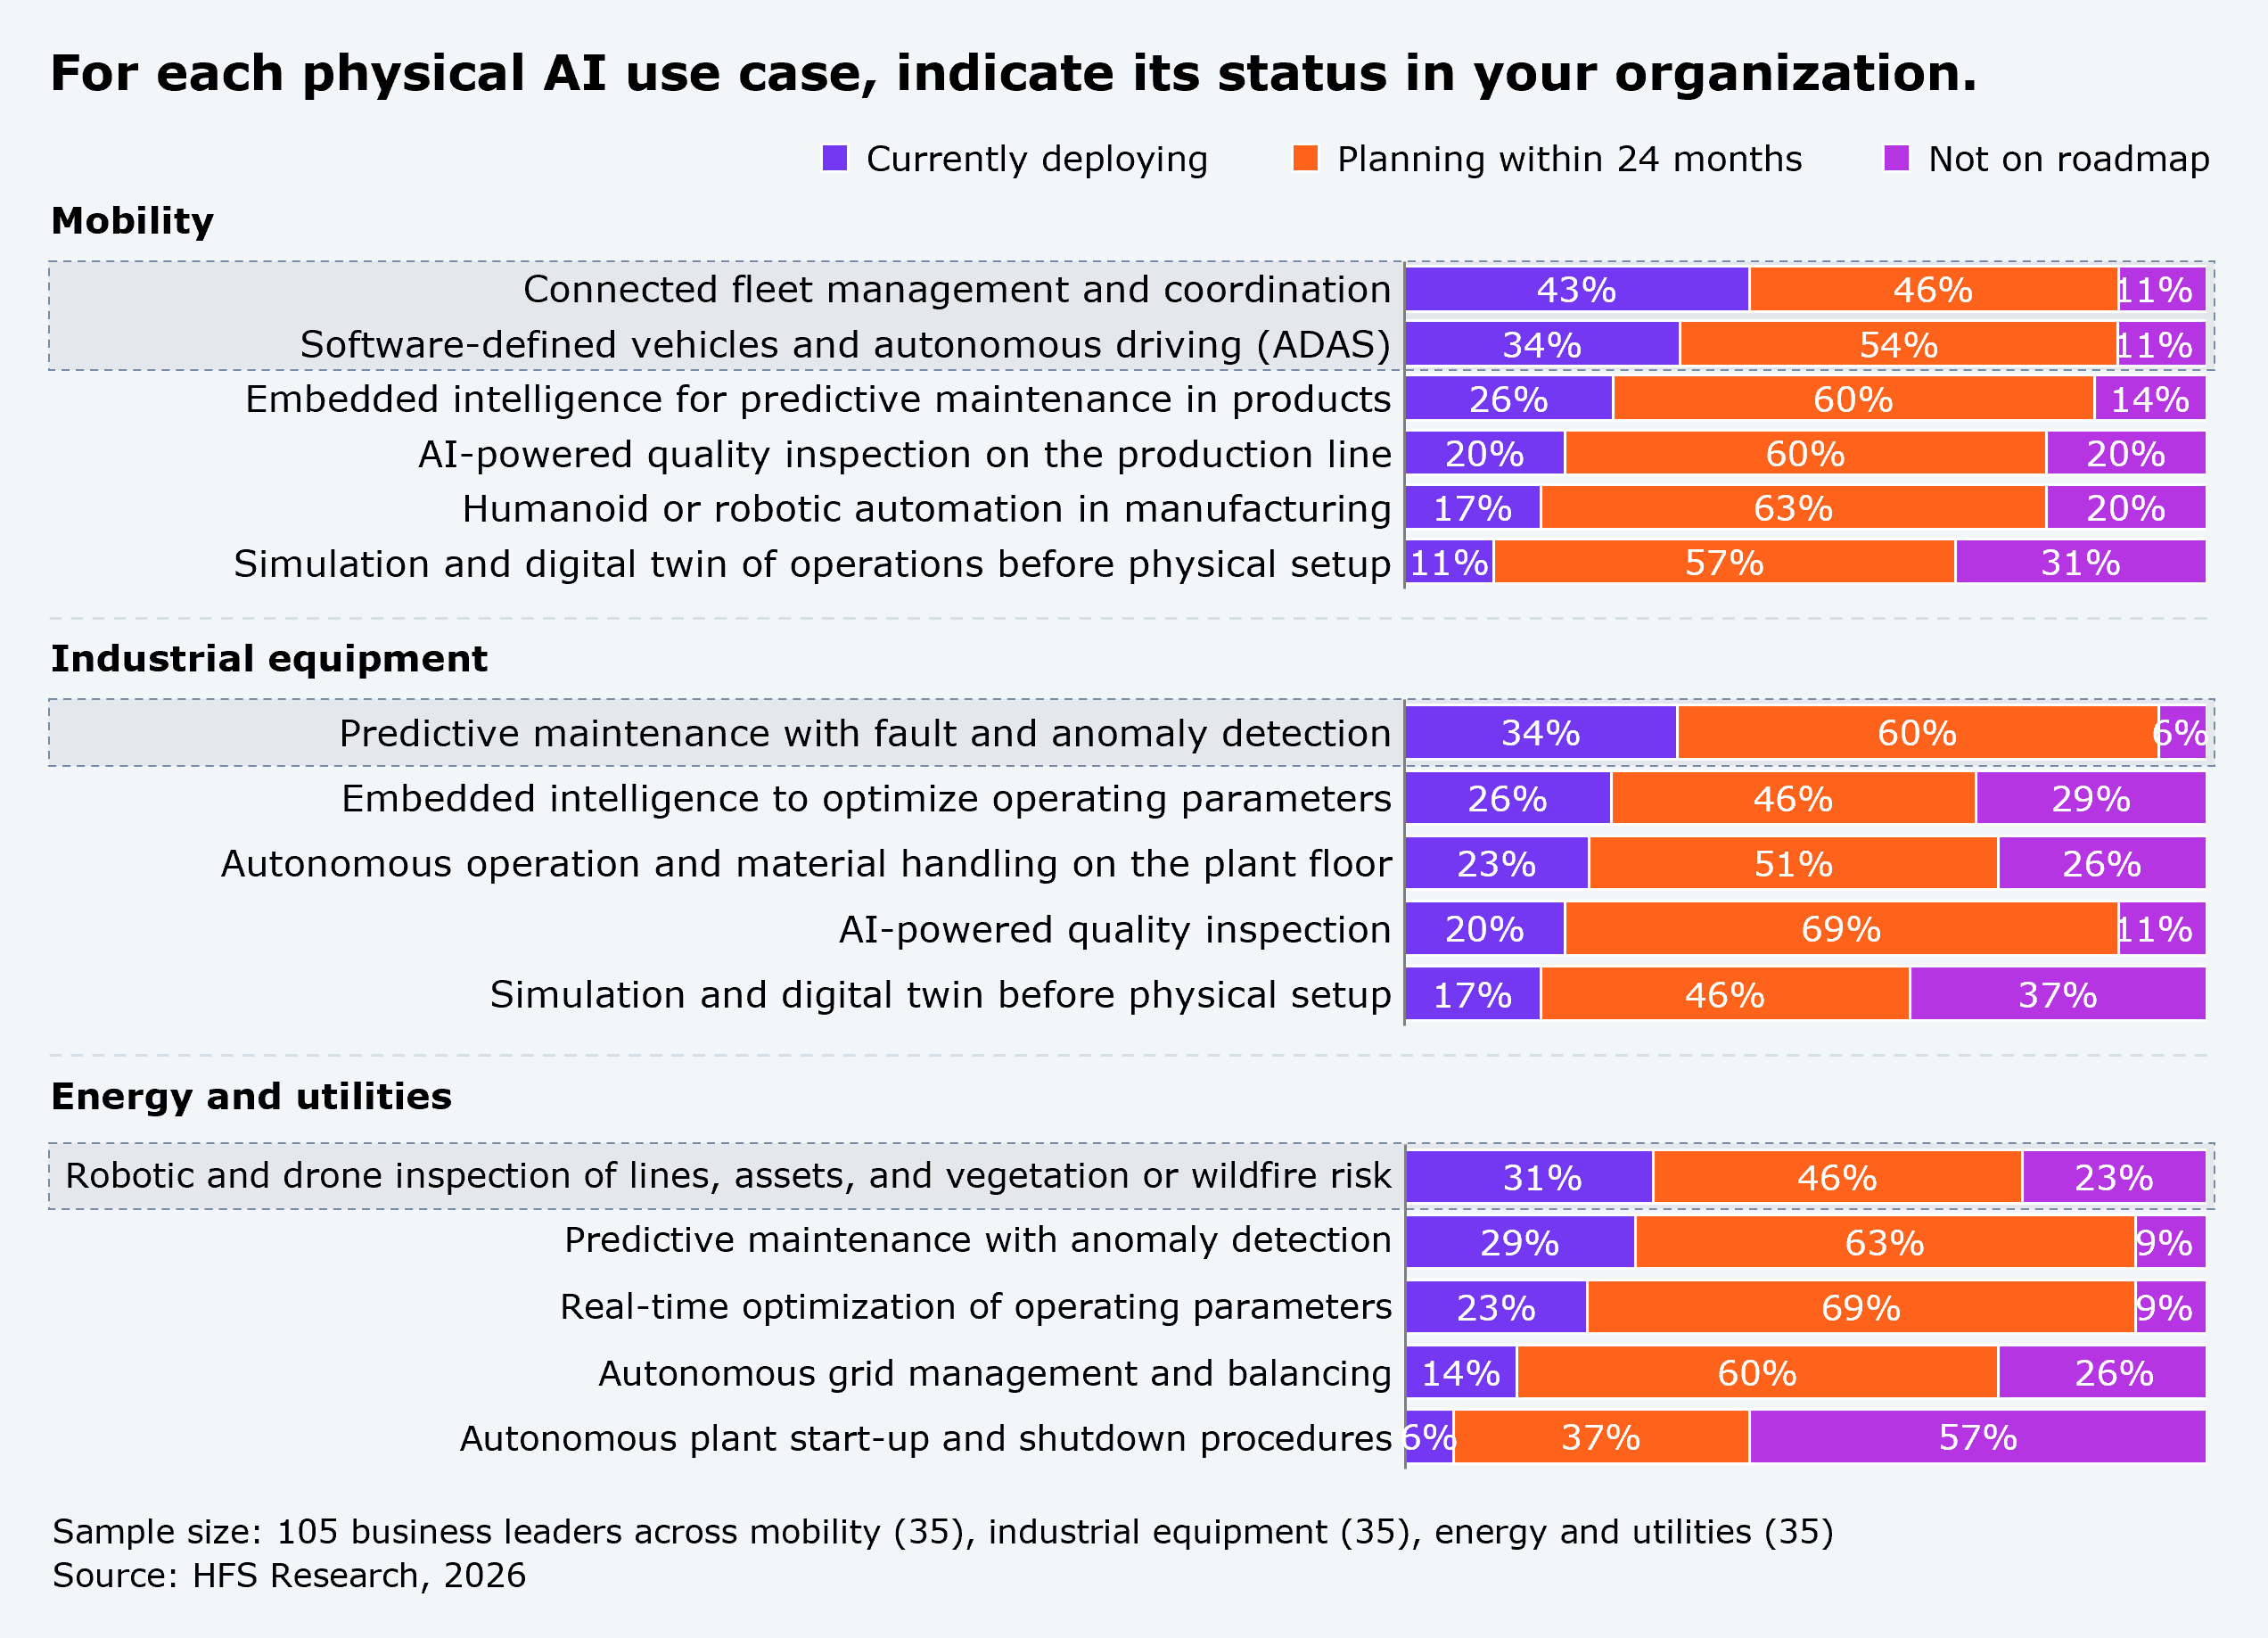
  • Physical AI is deployed where legacy tech was lacking, with 43% of enterprises running connected fleets in mobility

A 100% stacked horizontal bar chart titled "For each physical AI use case, indicate its status in your organization," grouped into three industry verticals: mobility, industrial equipment, and energy and utilities. Each use case is broken into three segments: currently deploying, planning within 24 months, and not on roadmap. In mobility, connected fleet management and coordination shows 43% currently deploying, 46% planning within 24 months, and 11% not on roadmap. Software-defined vehicles and autonomous driving (ADAS) shows 34%, 54%, and 11%. Embedded intelligence for predictive maintenance in products shows 26%, 60%, and 14%. AI-powered quality inspection on the production line shows 20%, 60%, and 20%. Humanoid or robotic automation in manufacturing shows 17%, 63%, and 20%. Simulation and digital twin of operations before physical setup shows 11%, 57%, and 31%. In industrial equipment, predictive maintenance with fault and anomaly detection shows 34%, 60%, and 6%. Embedded intelligence to optimize operating parameters shows 26%, 46%, and 29%. Autonomous operation and material handling on the plant floor shows 23%, 51%, and 26%. AI-powered quality inspection shows 20%, 69%, and 11%. Simulation and digital twin before physical setup shows 17%, 46%, and 37%. In energy and utilities, robotic and drone inspection of lines, assets, and vegetation or wildfire risk shows 31%, 46%, and 23%. Predictive maintenance with anomaly detection shows 29%, 63%, and 9%. Real-time optimization of operating parameters shows 23%, 69%, and 9%. Autonomous grid management and balancing shows 14%, 60%, and 26%. Autonomous plant start-up and shutdown procedures shows 6%, 37%, and 57%. Sample: 105 business leaders across mobility (35), industrial equipment (35), and energy and utilities (35). Source: HFS Research, 2026.

Legacy systems could sense and flag operations, but not reason and act. Recent advances in physical AI, including foundation models, edge inference, and reinforcement learning, address these barriers for large-scale, critical applications of use cases that had been underserved by technologies.

  • Mobility: Fleet management (43%) and software-defined vehicles (34%) act upon what legacy telematics could only track. Hitachi Digital Services’ Guided Repair, for example, holds repair sessions for around 11,500 Penske technicians in more than 990 locations to identify and execute repairs.
  • Industrial equipment: Predictive maintenance (34%) leads, with traditional monitoring only flagging abnormalities, while physical AI triages where the fault sits and times overhauls, turning detection into action.
  • Energy and utilities: Robotic and drone inspection (31%) leads in inspection, a high-risk, labor-intensive, and hard-to-scale application. Physical AI makes it feasible and safe in critical situations, such as the Fukushima Daiichi nuclear disaster site.
  • The path forward: Enterprises should identify core operations set aside earlier because of a lack of technical feasibility or affordability, and re-examine them with physical AI, where latent value sits and ROI comes fastest.
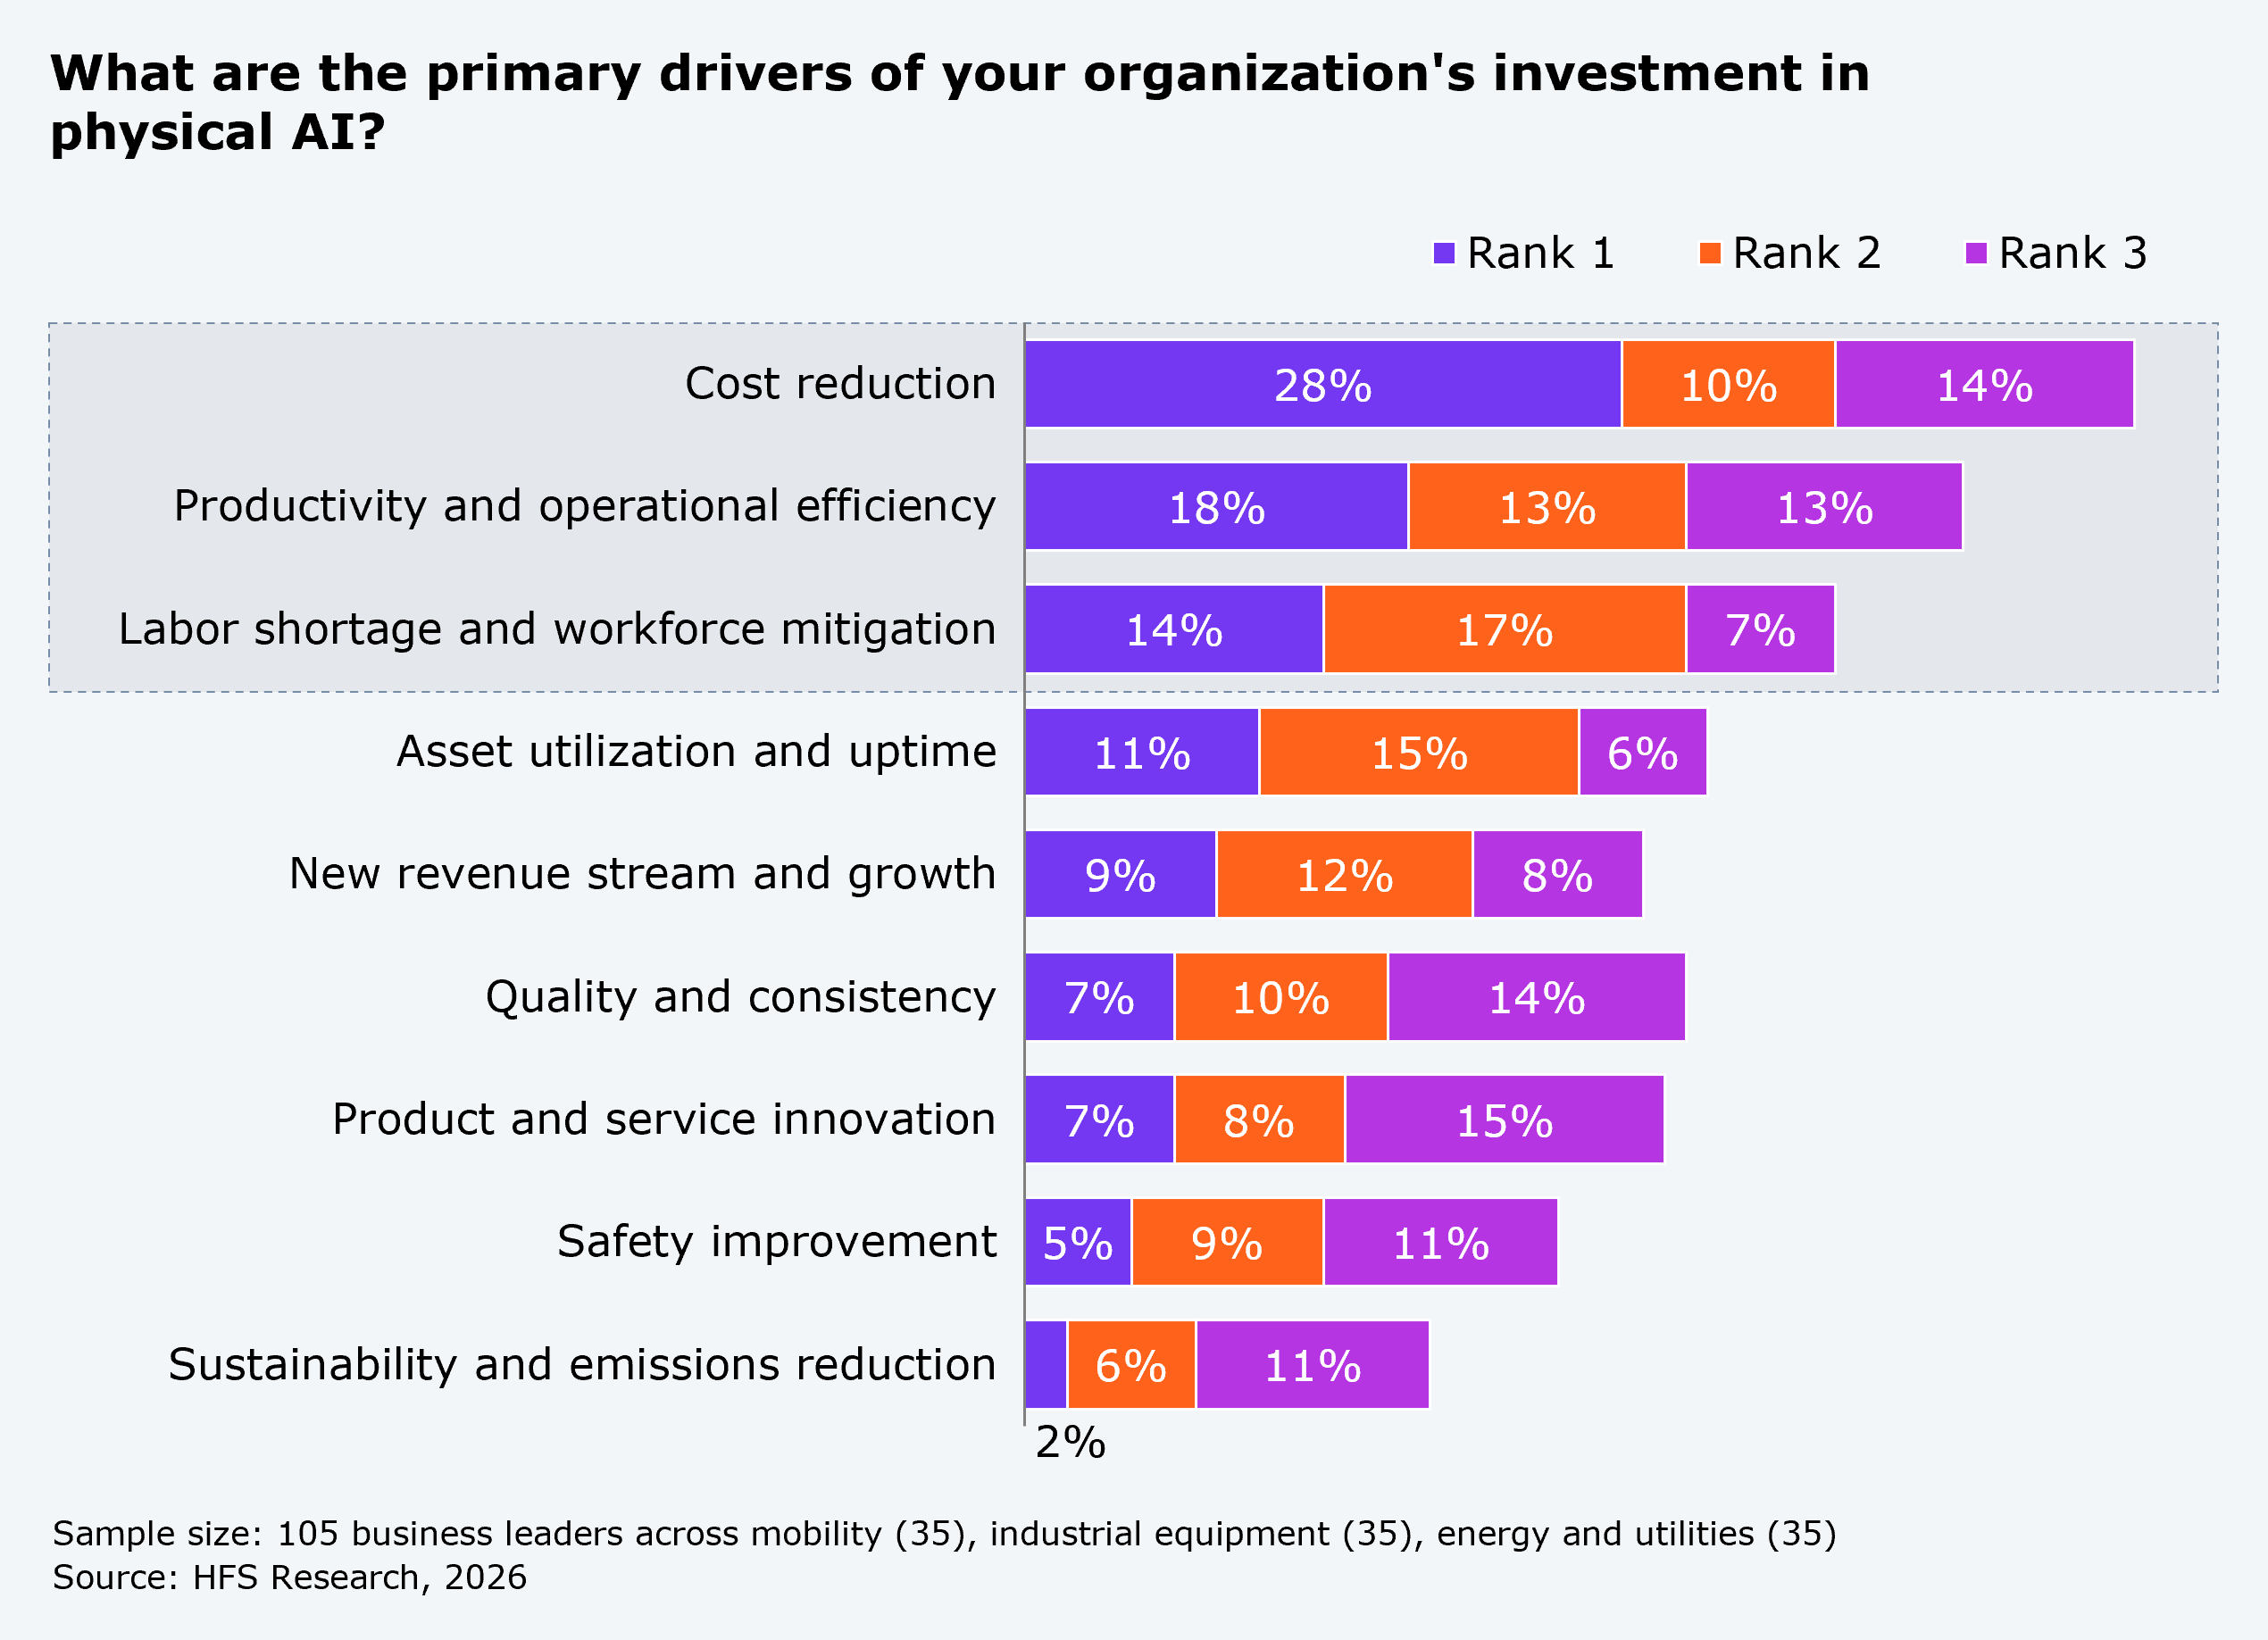
  • Businesses fund what pays back fast: cost reduction tops the list at 28%, followed by productivity and talent

A segmented horizontal bar chart titled "What are the primary drivers of your organization's investment in physical AI?," showing the percentage of respondents ranking each driver first, second, or third. Cost reduction ranks first for 28% of respondents, second for 10%, and third for 14%. Productivity and operational efficiency ranks first for 18%, second for 13%, and third for 13%. Labor shortage and workforce mitigation ranks first for 14%, second for 17%, and third for 7%. Asset utilization and uptime ranks first for 11%, second for 15%, and third for 6%. New revenue stream and growth ranks first for 9%, second for 12%, and third for 8%. Quality and consistency ranks first for 7%, second for 10%, and third for 14%. Product and service innovation ranks first for 7%, second for 8%, and third for 15%. Safety improvement ranks first for 5%, second for 9%, and third for 11%. Sustainability and emissions reduction ranks first for 2%, second for 6%, and third for 11%. Sample: 105 business leaders across mobility (35), industrial equipment (35), and energy and utilities (35). Source: HFS Research, 2026.

Asset-heavy industries under pressure to improve their thin margins deploy physical AI where it helps the most: for cost reduction (28%), productivity and efficiency (18%), and to address talent shortages (14%).

  • Applying lessons learned from earlier deployments of enterprise IT systems, physical AI is applied in areas with tangible business impact.
  • Under mobility, with rising logistics costs, a 174,000-driver shortage in the US, and productivity capped at 60%, physical AI offers autonomous trucks for hub-to-hub material movement.
  • Revenue-generating streams are also on the radar, though not in the short term. Some tractor manufacturers already sell autonomy as a subscription, and robotics suppliers offer humanoids as-a-service to car makers, turning upfront capex into recurring revenue.
  • Choosing use cases that deliver ROI first then gradually move toward revenue generation is an effective approach for physical AI adoption.
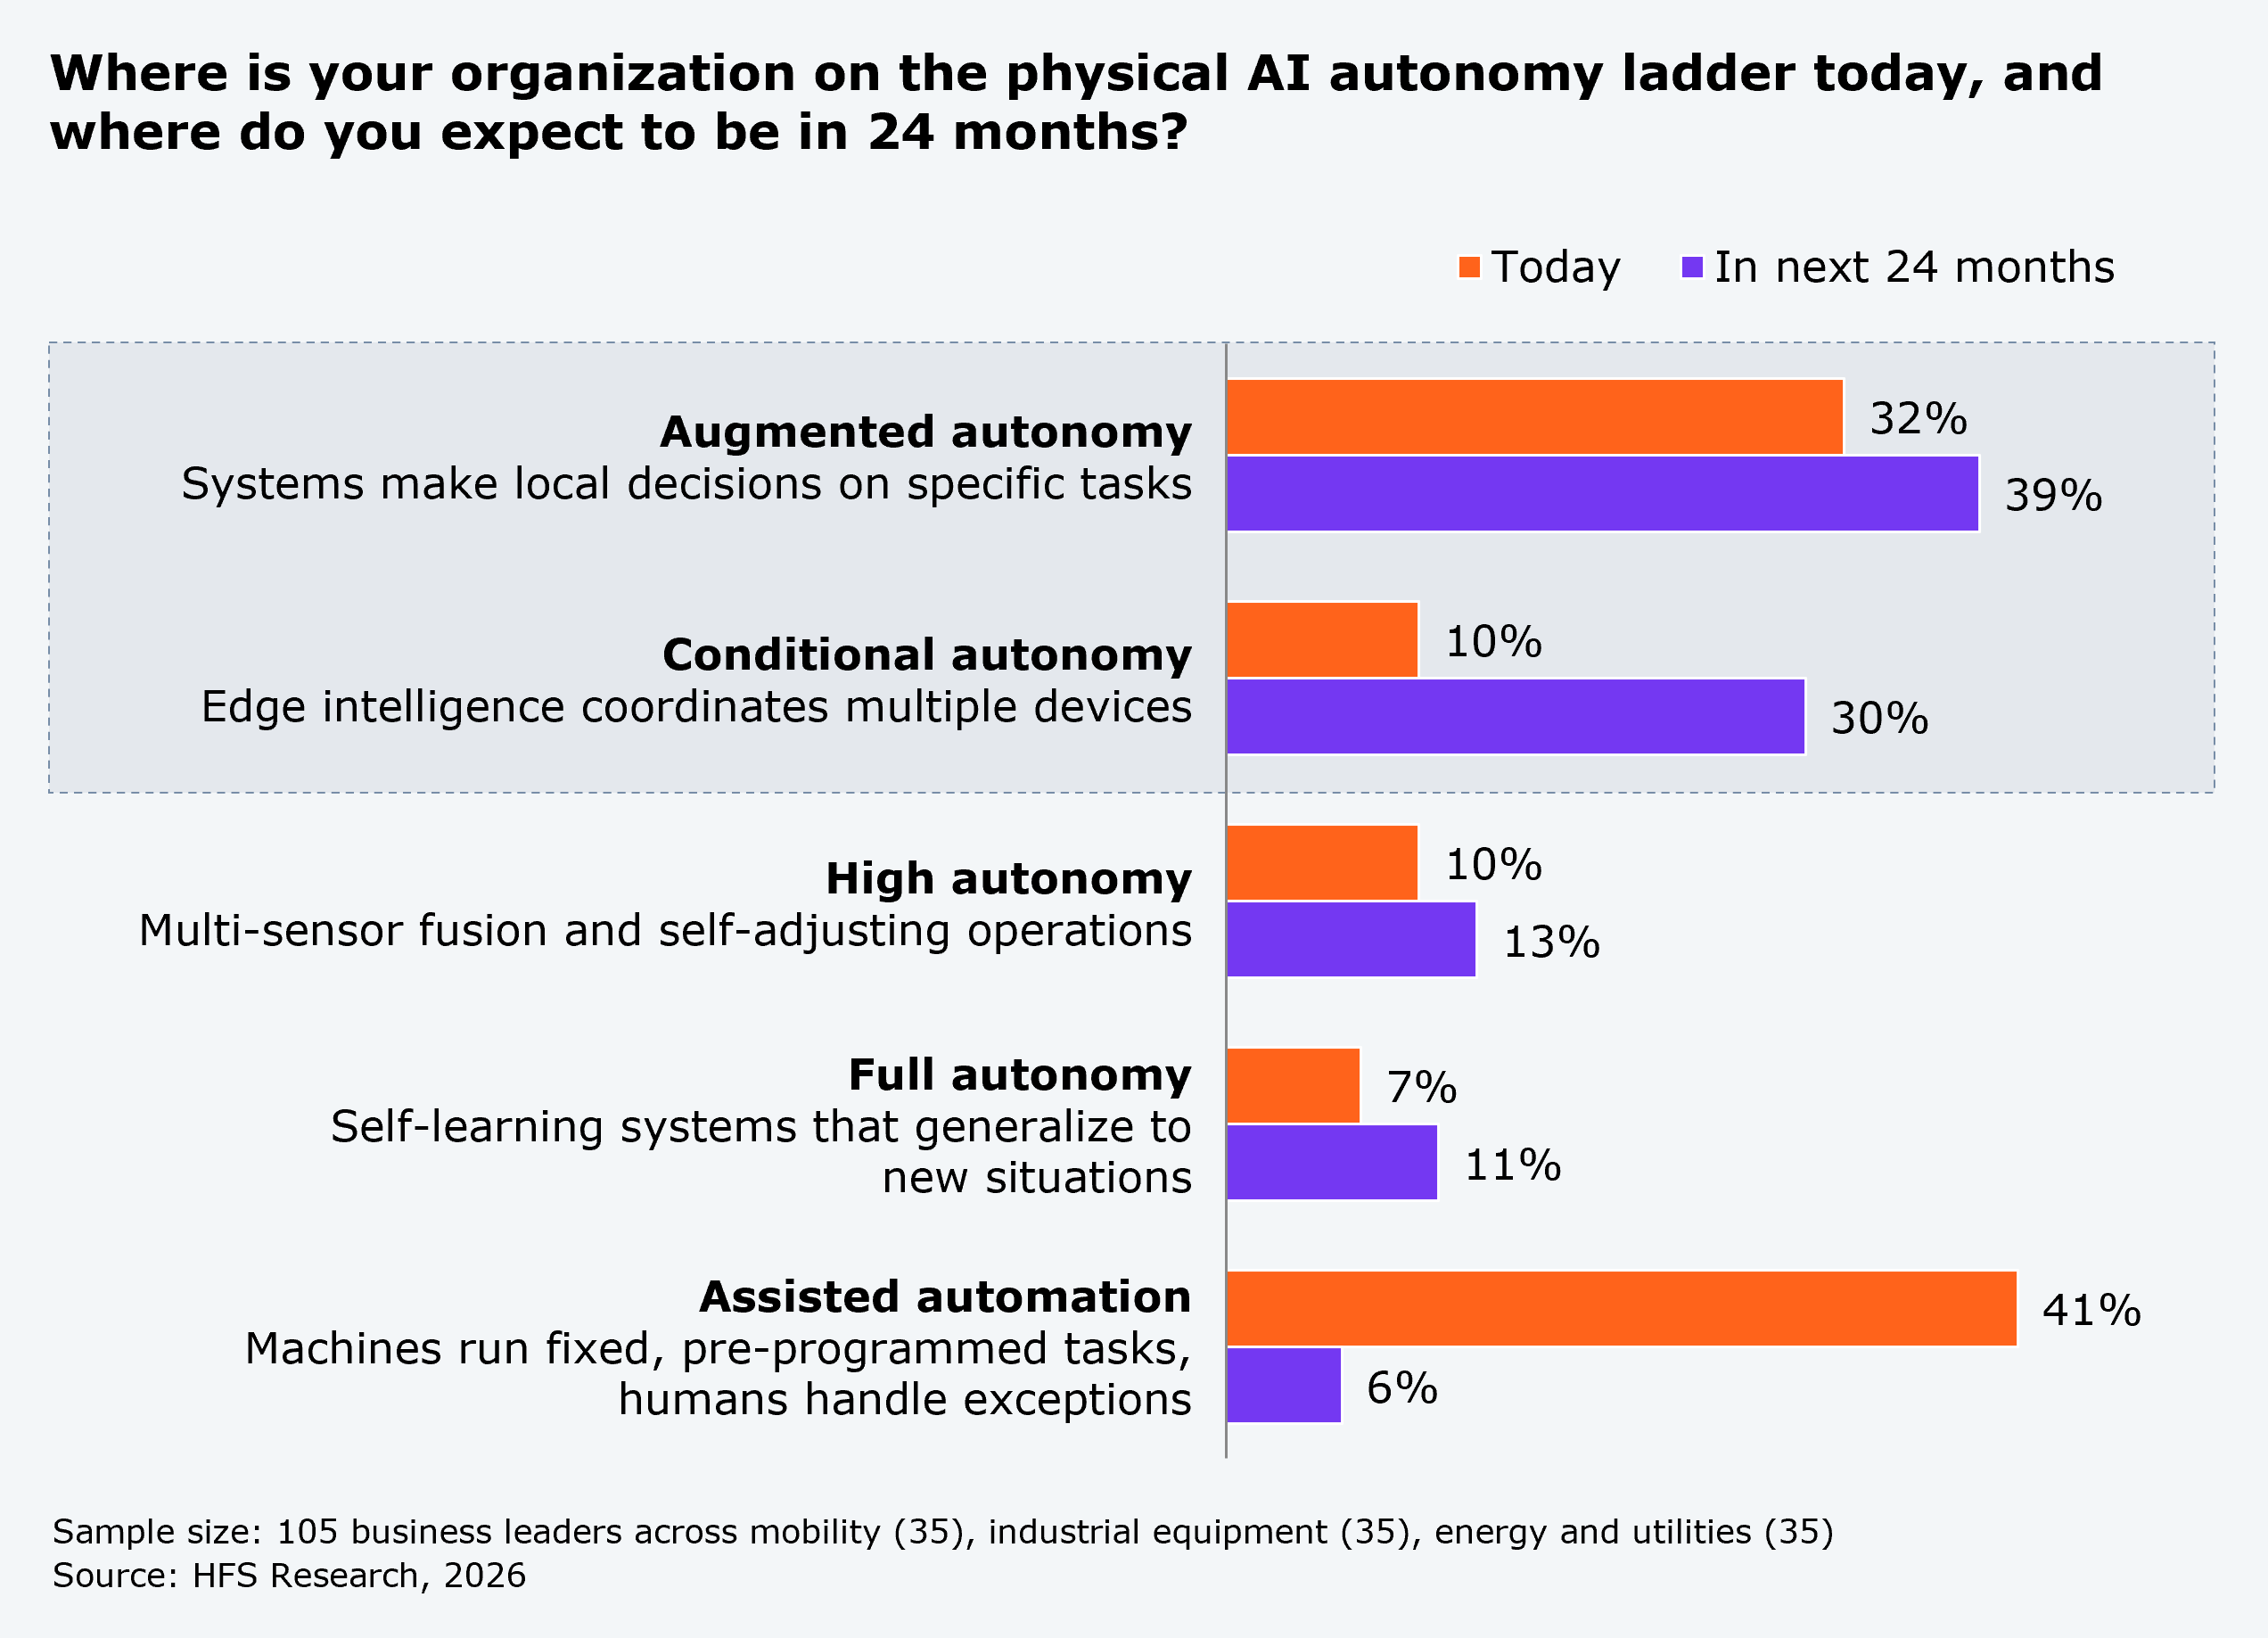
  • Enterprises are taking a pragmatic adoption roadmap, as augmented autonomy becomes the norm at 39% within 24 months

Horizontal bar chart titled "Where is your organization on the physical AI autonomy ladder today, and where do you expect to be in 24 months?" It shows two series, Today and In next 24 months, across five autonomy levels defined from least to most advanced. Assisted automation (machines run fixed, pre-programmed tasks, humans handle exceptions): 41% today, 6% in 24 months. Full autonomy (self-learning systems that generalize to new situations): 7% today, 11% in 24 months. High autonomy (multi-sensor fusion and self-adjusting operations): 10% today, 13% in 24 months. Conditional autonomy (edge intelligence coordinates multiple devices): 10% today, 30% in 24 months. Augmented autonomy (systems make local decisions on specific tasks): 32% today, 39% in 24 months. Sample size: 105 business leaders across mobility (35), industrial equipment (35), and energy and utilities (35). Source: HFS Research, 2026.

The falling cost of physical AI and rising maturity of related technologies incentivize enterprises to progress toward advanced levels of autonomy on their physical AI adoption roadmap.

  • Augmented autonomy with edge-based decisions for specific tasks will see the most investment among 39% of enterprises over the next 24 months.
  • Conditional autonomy with multimodal edge intelligence, coordinating multiple diverse devices will be the highest level of autonomy in the next two years that will see large-scale adoption for applications such as fleet and swarm management.
  • High and full autonomy use cases, such as Level 4 and 5 driverless automobiles, will take more than two years to mature and achieve large-scale adoption, first for industrial applications. Factories will see lights-out implementations in specific areas, if not the entire factory.
  • Enterprises must assess where they are in the adoption roadmap today and plan their future.
  • A strong business case, not technology maturity, gates adoption, with high upfront cost the top challenge for 22% of enterprises
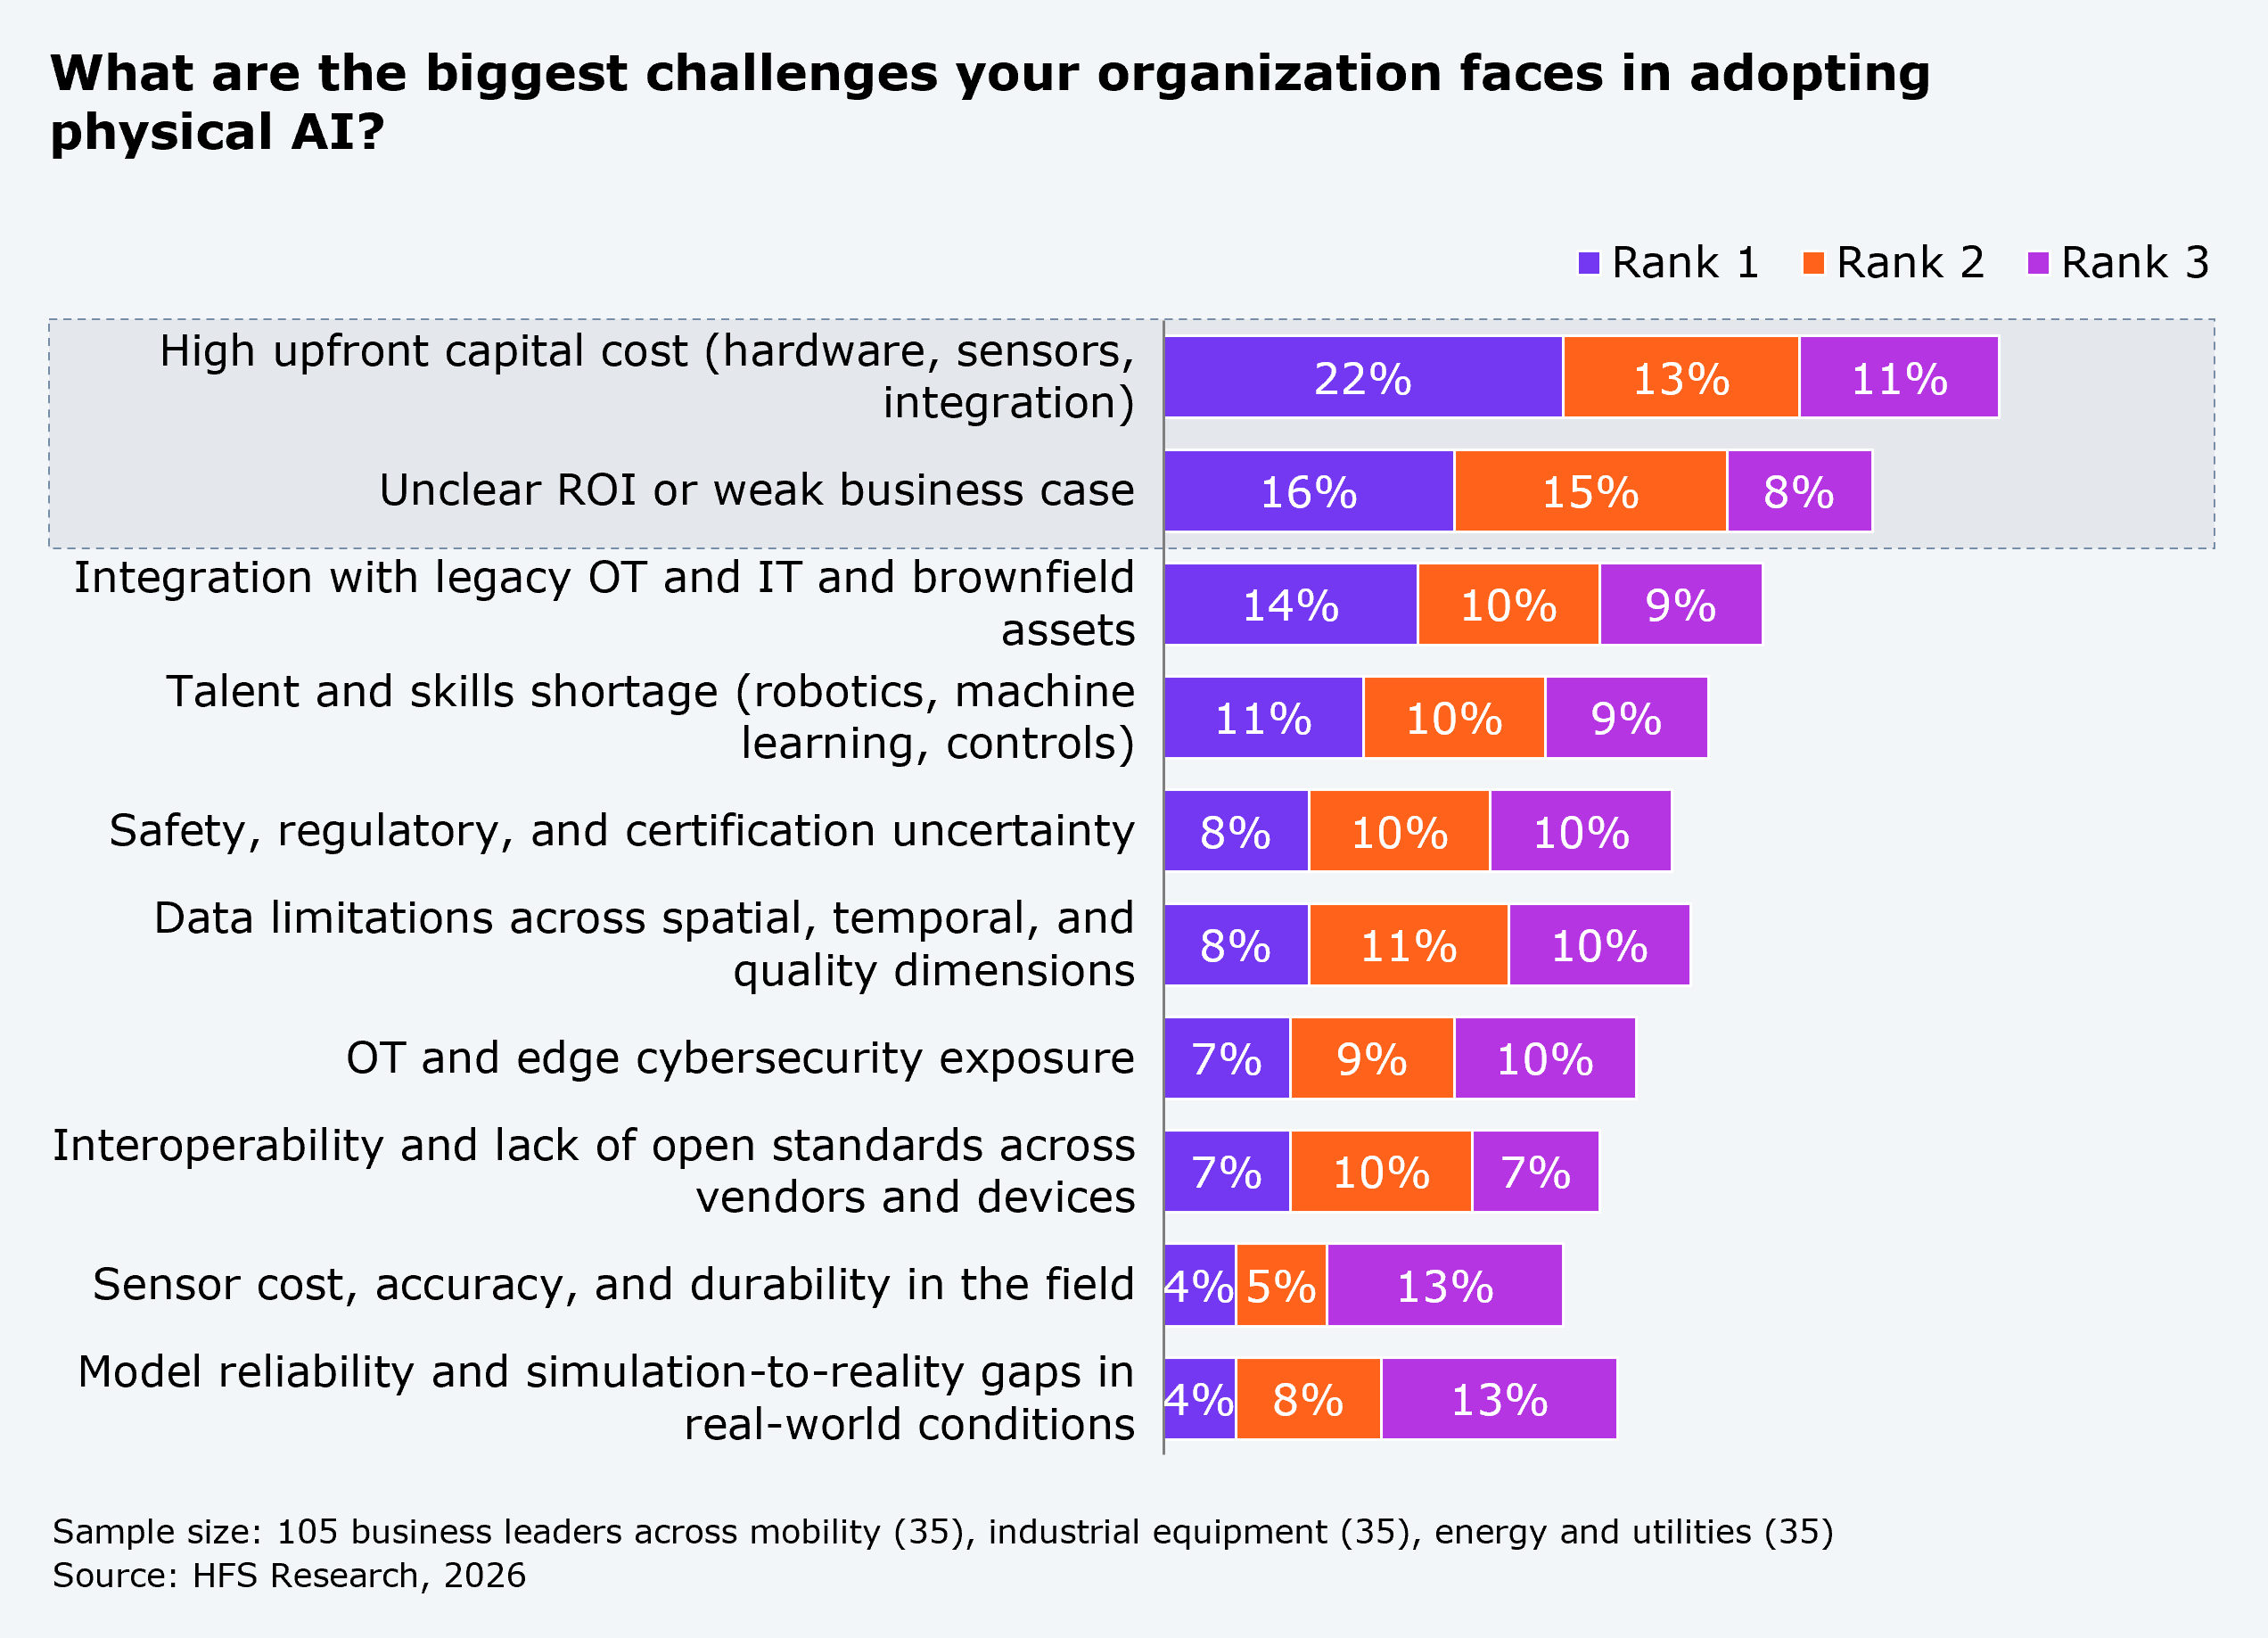
A segmented horizontal bar chart titled "What are the biggest challenges your organization faces in adopting physical AI?," showing the percentage of respondents ranking each challenge first, second, or third. High upfront capital cost, covering hardware, sensors, and integration, ranks first for 22%, second for 13%, and third for 11%. Unclear ROI or weak business case ranks first for 16%, second for 15%, and third for 8%. Integration with legacy OT and IT and brownfield assets ranks first for 14%, second for 10%, and third for 9%. Talent and skills shortage in robotics, machine learning, and controls ranks first for 11%, second for 10%, and third for 9%. Safety, regulatory, and certification uncertainty ranks first for 8%, second for 10%, and third for 10%. Data limitations across spatial, temporal, and quality dimensions ranks first for 8%, second for 11%, and third for 10%. OT and edge cybersecurity exposure ranks first for 7%, second for 9%, and third for 10%. Interoperability and lack of open standards across vendors and devices ranks first for 7%, second for 10%, and third for 7%. Sensor cost, accuracy, and durability in the field ranks first for 4%, second for 5%, and third for 13%. Model reliability and simulation-to-reality gaps in real-world conditions ranks first for 4%, second for 8%, and third for 13%. Sample: 105 business leaders across mobility (35), industrial equipment (35), and energy and utilities (35). Source: HFS Research, 2026.

  • The top barriers are commercial first: high upfront costs (22%) and weak ROI (16%) lead the list. Enterprises are reading this correctly. Physical AI is capital-intensive, so the discipline is to prove a clear business case before scaling, not chase use cases and hope value follows.
  • This reflects a lesson from the broader AI wave. Having seen pilots expand without clear payback, enterprises are being more selective. They are funding physical AI where the operational case is unambiguous and where value can be measured early.
  • The real work is data and integration. Physical AI has to fuse physical and digital systems and learn from a new class of data, the temporal and spatial signals that describe how equipment behaves in the real world, which is costly to capture, engineer, and maintain. Solving that foundation, not the algorithms, is what turns a pilot into production.
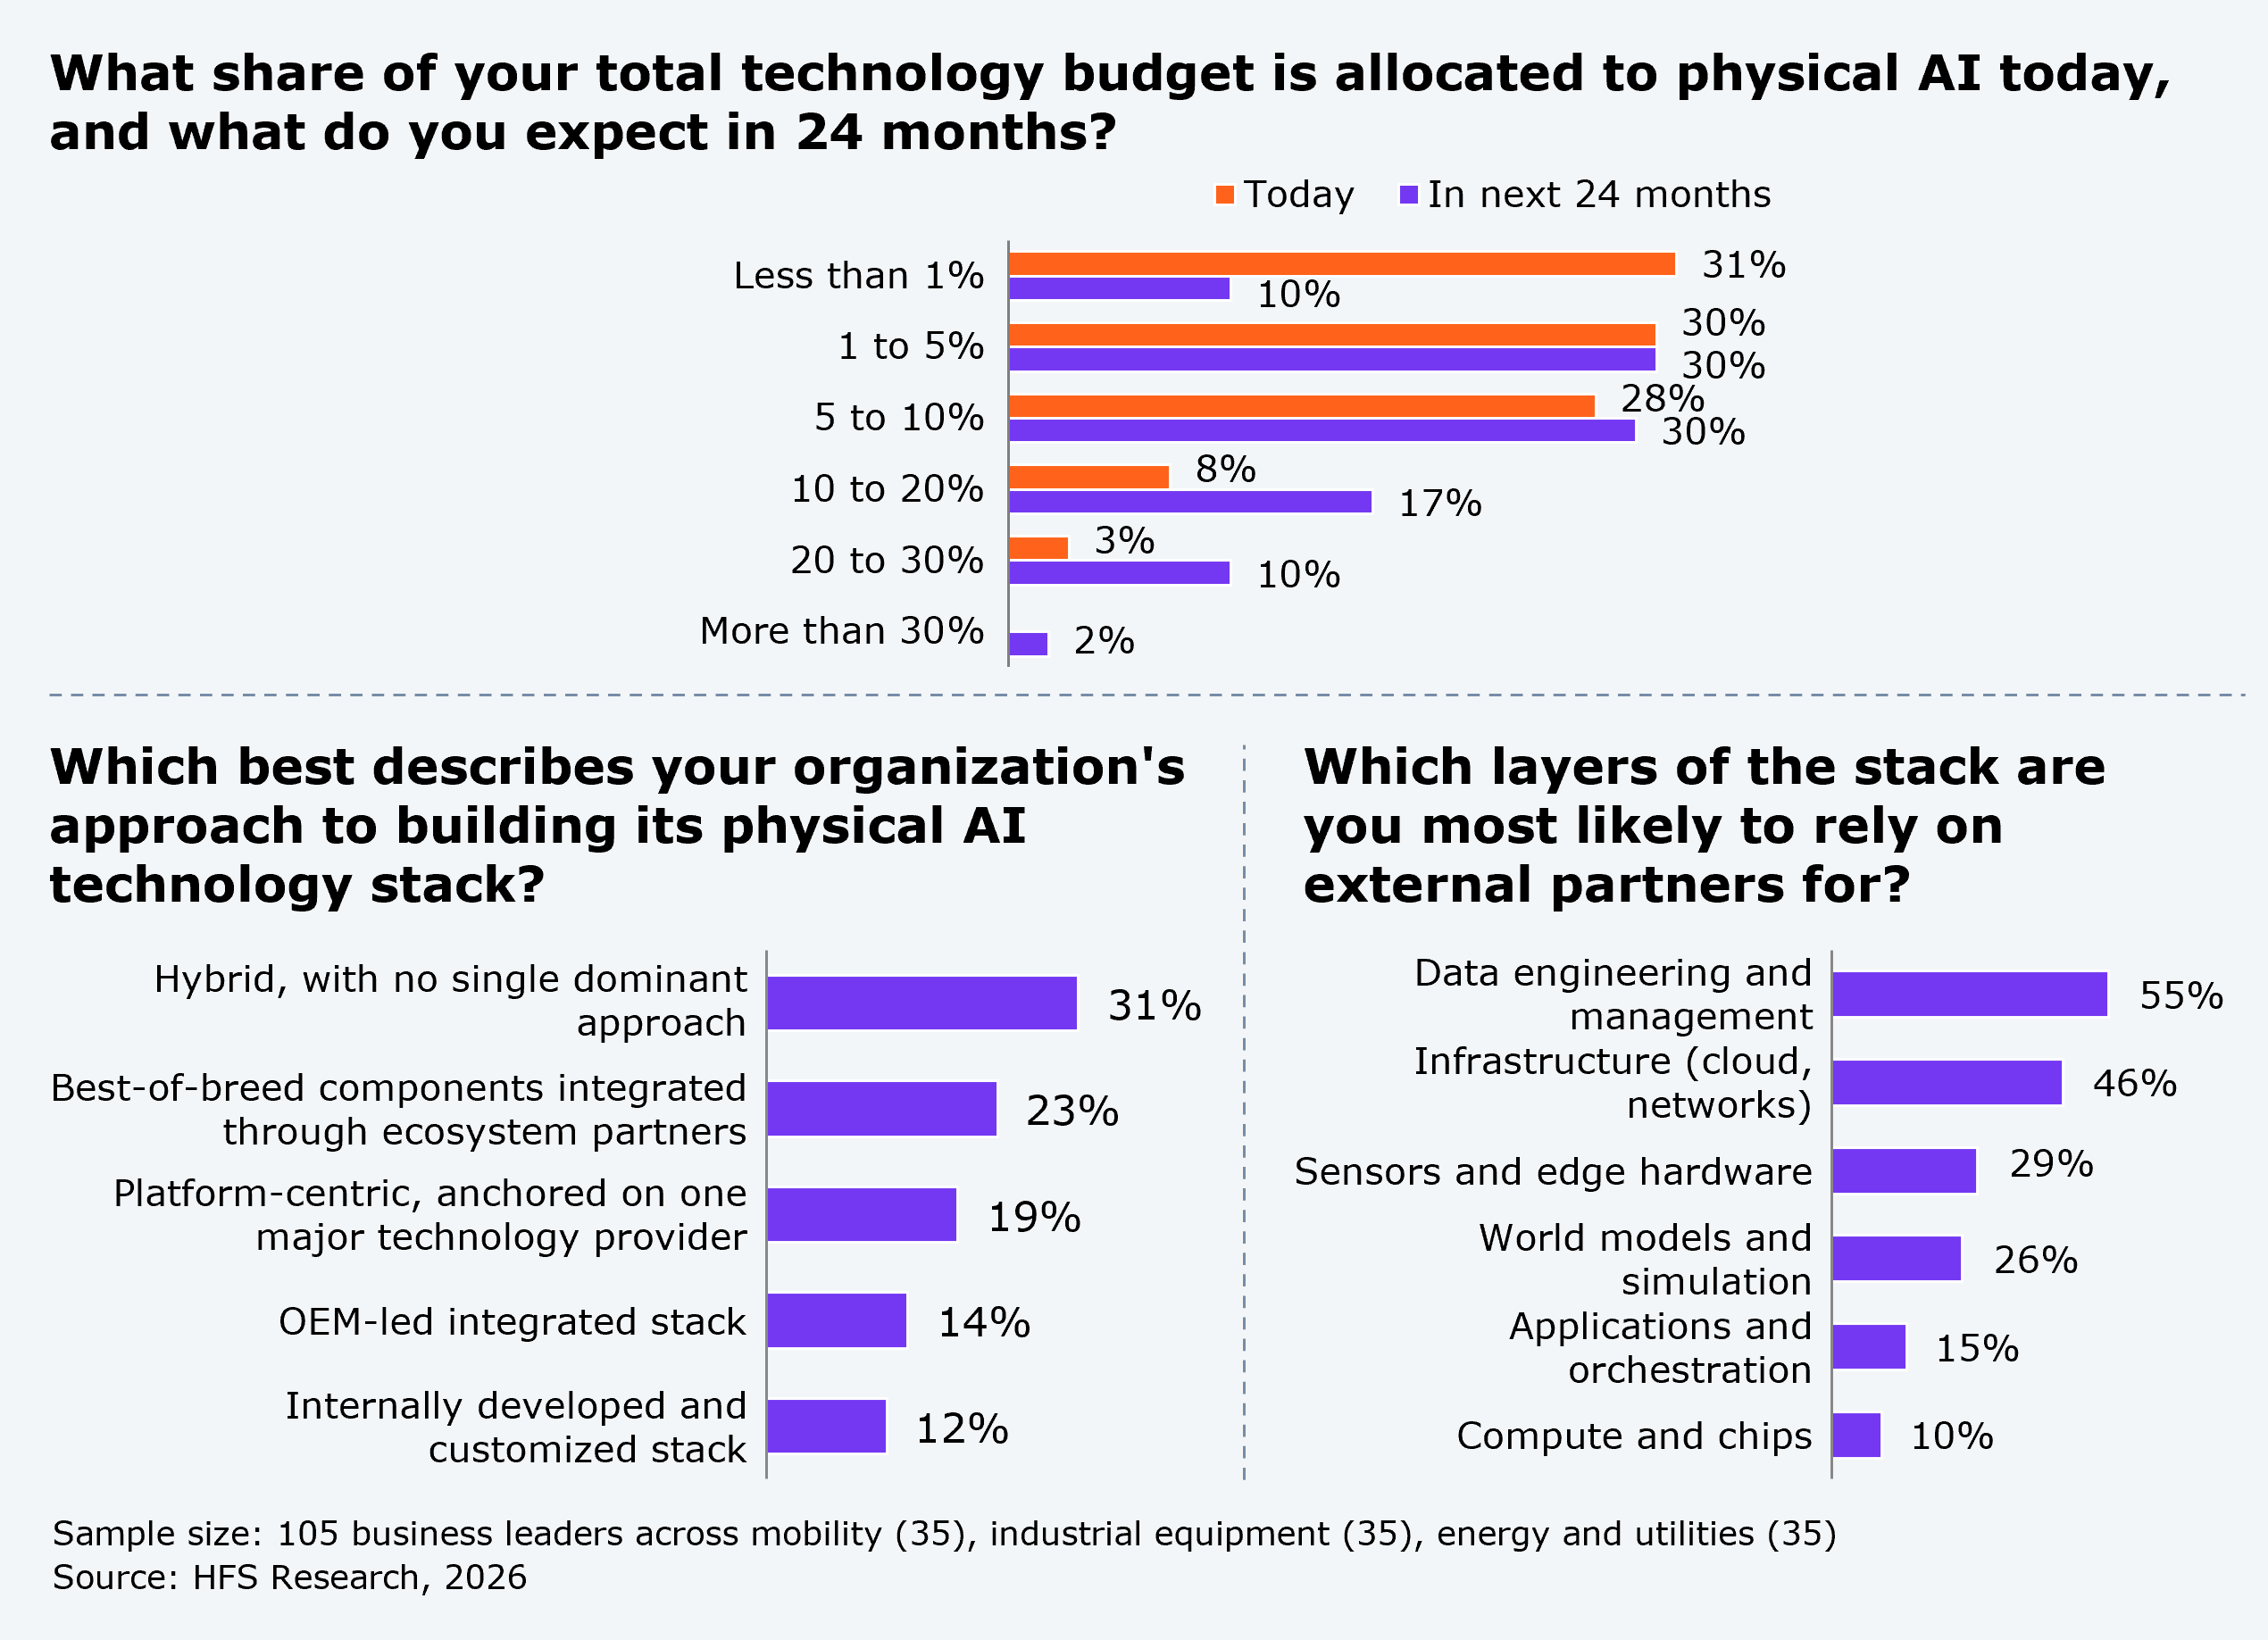
  • Business leaders are optimistic about doubling physical AI spend, using a hybrid approach involving multiple vendors

A page containing three related bar charts on physical AI technology investment and sourcing. The first is a grouped horizontal bar chart titled "What share of your total technology budget is allocated to physical AI today, and what do you expect in 24 months?," across six spending bands. Less than 1% of budget is allocated by 31% of respondents today, falling to 10% in 24 months. 1% to 5% is allocated by 30% today and 30% in 24 months. 5% to 10% is allocated by 28% today and 30% in 24 months. 10% to 20% is allocated by 8% today and 17% in 24 months. 20% to 30% is allocated by 3% today and 10% in 24 months. More than 30% is allocated by 2% in 24 months, with no respondents reporting that level today. The second chart is a single-series horizontal bar chart titled "Which best describes your organization's approach to building its physical AI technology stack?," showing a hybrid approach with no single dominant method at 31%, best-of-breed components integrated through ecosystem partners at 23%, a platform-centric approach anchored on one major technology provider at 19%, an OEM-led integrated stack at 14%, and an internally developed and customized stack at 12%. The third chart is a single-series horizontal bar chart titled "Which layers of the stack are you most likely to rely on external partners for?," showing data engineering and management at 55%, infrastructure covering cloud and networks at 46%, sensors and edge hardware at 29%, world models and simulation at 26%, applications and orchestration at 15%, and compute and chips at 10%. Sample: 105 business leaders across mobility (35), industrial equipment (35), and energy and utilities (35). Source: HFS Research, 2026.

  • Physical AI is set to roughly double its share of the technology budget over the next two years, moving from experimentation to a funded priority.
  • But enterprises are not betting the budget on one provider. A hybrid and best-of-breed approach is emerging because no single vendor can span the full physical AI stack, from compute and platforms to devices and hardware, data engineering, infrastructure, and applications. Buyers are keeping compute and applications closer, while relying more on partners for data engineering and infrastructure.
  • The provider opportunity is not to own the whole stack. It is to win the layers where buyers need the most help, integrate cleanly around the compute and platform providers they have already chosen, and lower the entry barrier through consumption or outcome-based commercial models that reduce upfront capex pressure.
The Bottom Line: Enterprises must identify and adopt physical AI to unlock latent value in critical operations and use cases that could not be addressed before due to technologies that were not ready functionally or economically.

Enterprises should start their physical AI journey with critical operations where earlier digital technologies could not fully unlock value, and where physical AI can prove measurable ROI in the near term through cost, productivity, uptime, safety, or labor impact.

Scaling will require more than robots, sensors, and edge models. It needs data engineering, spatial and temporal data, foundational models, IT/OT integration, infrastructure, and governance across physical and digital systems. Keep humans in the loop through the early stages; autonomy should scale as the foundations mature.

  • Business leaders must identify critical use cases that could not be implemented earlier using traditional technologies for physical AI applications
  • Enterprises must assess their readiness for physical AI, identify weak spots across the tech stack, and identify trusted partners for those layers
  • Scaling physical AI will need data engineering, spatial and temporal data, IT/OT integration, and governance at the intersection of physical and digital systems

Sign in to view or download this research.

Login

Register

Insight. Inspiration. Impact.

Register now for immediate access of HFS' research, data and forward looking trends.

Get Started

Download Research

    Sign In

    Sign up for a free
    research account

    With the exception of our Horizons reports, most of our research is available for free on our website. Sign up for a free account and start realizing the power of insights now.

    By registering you agree to our privacy policy.

    I hereby consent that HFS Research can process my personal data.

    Digests/Newsletters: Overviews of the latest news, insight, and research by HFS.

    HFS Events: Exclusive invitations to HFS webinars, roundtables, and summits, bringing together key industry stakeholders focused on major innovations impacting business operations.

    Premium Access

    Our premium subscription gives enterprise clients access to our complete library of proprietary research, direct access to our industry analysts, and other benefits.

    Contact us at [email protected] for more information on premium access.

      Contact Ask HFS AI Support