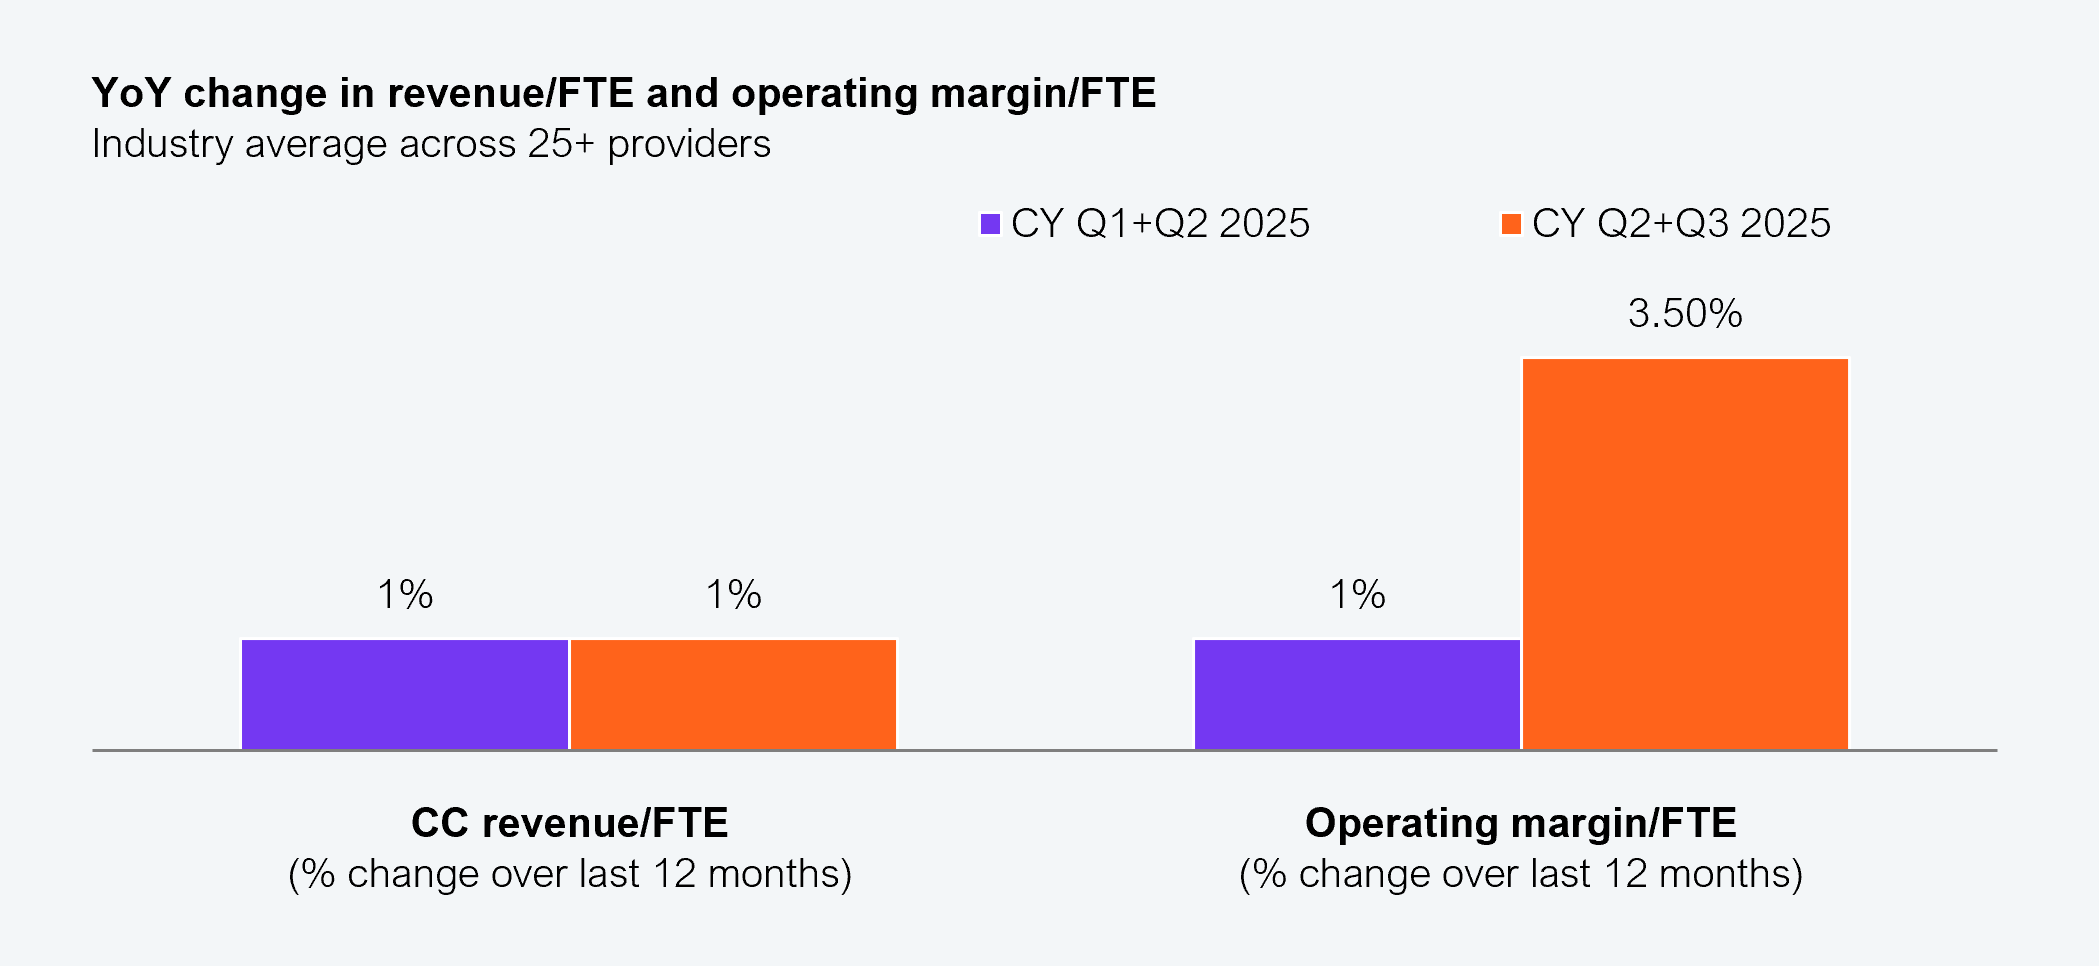
The IT and business services industry has long been operating on adding headcount to scale revenue and profit. That linear pyramid model is now giving way to something fundamentally different. Our analysis of more than 25 major service providers showed that average revenue per FTE grew ~1% YoY and operating margin per FTE improved ~3.5% YoY in CY Q2 and Q3 2025. These are small numbers but meaningful signals that value creation is starting to decouple from workforce expansion.
Within this broader transition, we identified 10 large and mid-scale service providers ranging from multi-billion dollar firms to scaled digital specialists that showed above-market movement toward non-linearity during that period. This shift marks the early emergence of Services-as-Software™ (SaS): an operating and delivery model defined not by how many people a provider can deploy, but by how much value each person, platform, and AI agent can generate. Providers are beginning to build once, deploy many, and scale value through software-like mechanisms rather than through linear headcount growth (see Exhibit 1).
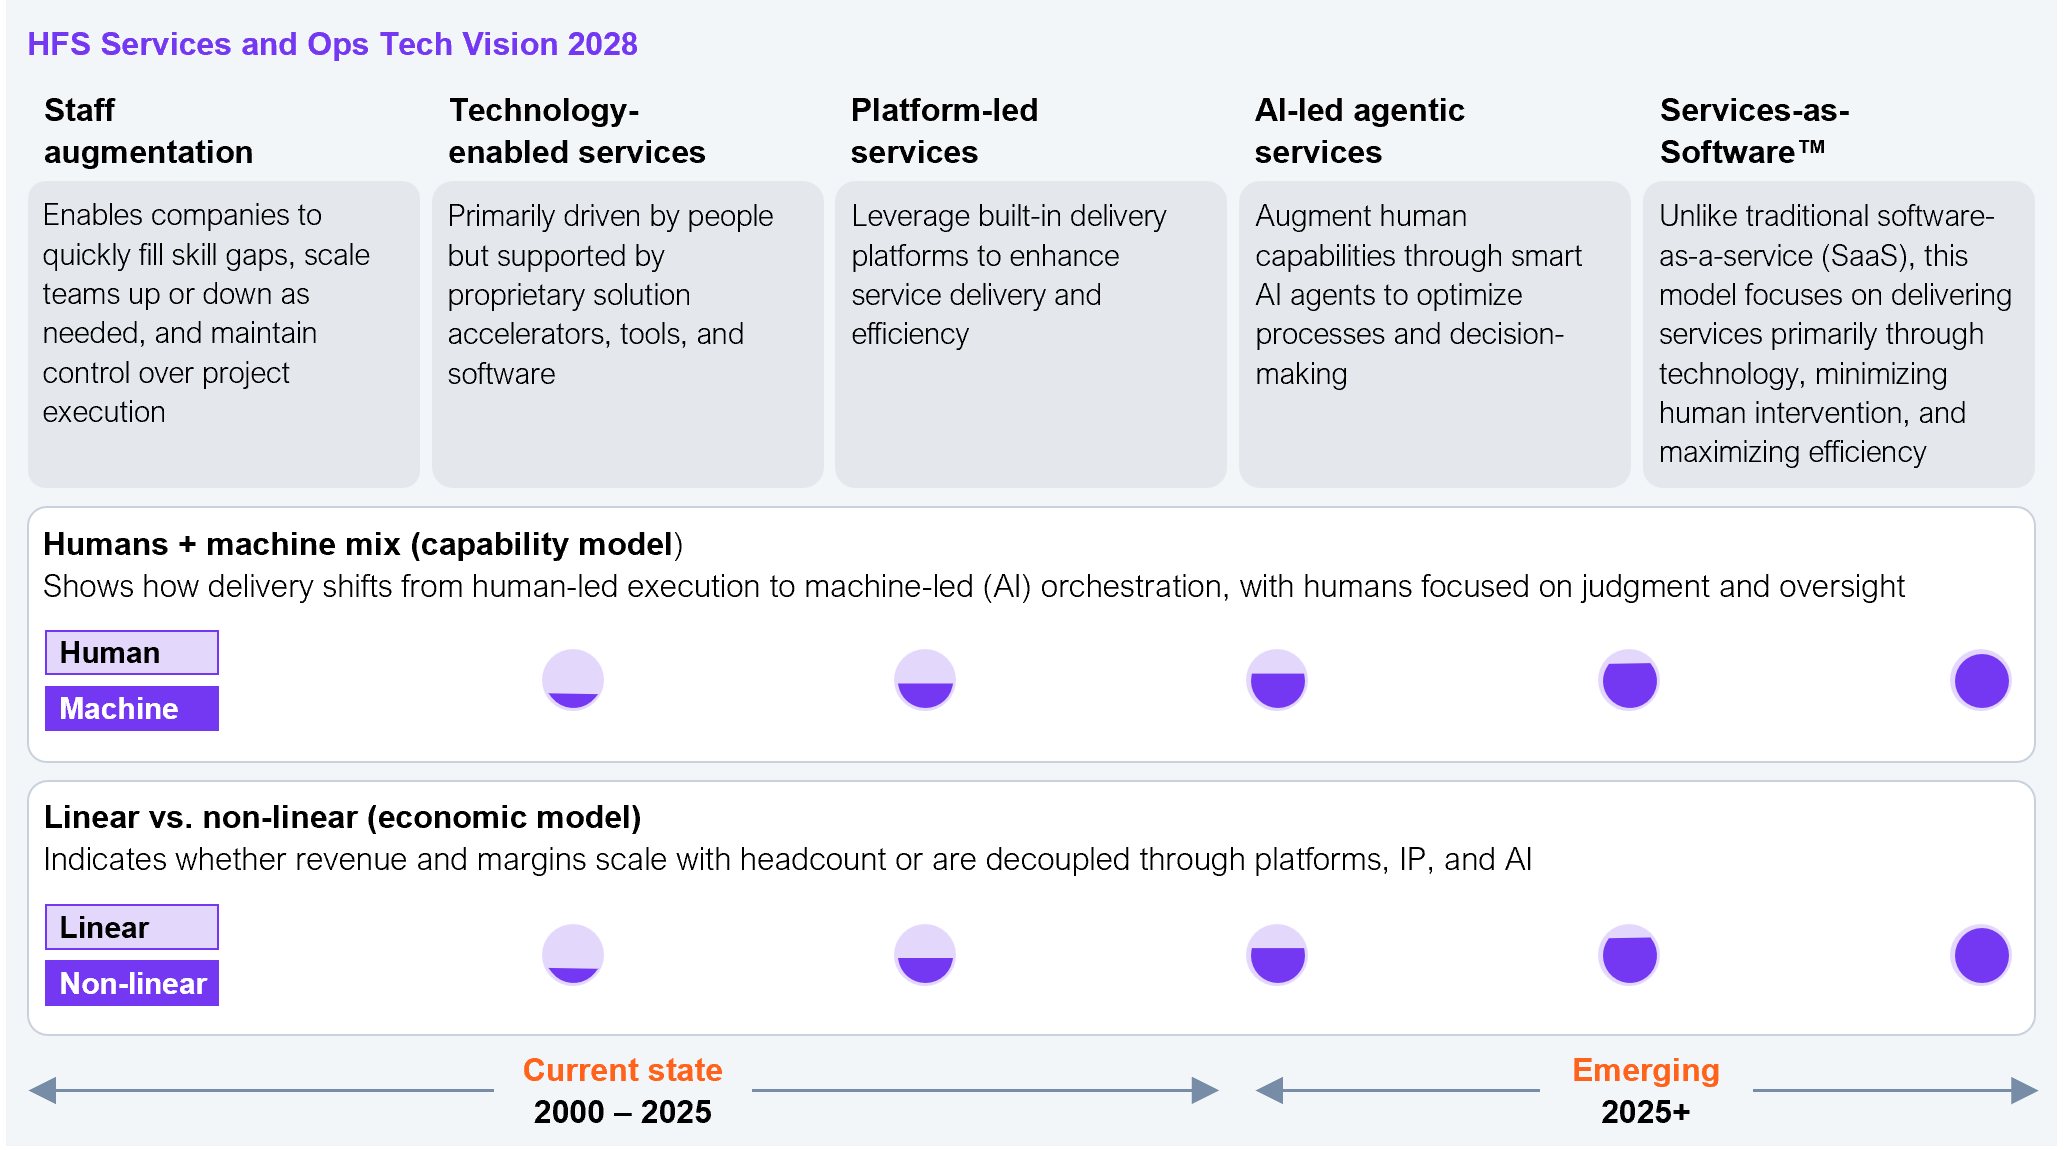
Exhibit 1: The HFS Services Tech Vision highlights a shift to a non-linear economic model enabled by adopting Service-as-Software (SaS)™
Source: HFS Research, 2026
This is not a technology fad, but a new economic model driven by the following shifts:
- Some providers are beginning to scale without scaling people, creating early signs of non-linearity.
- Providers that remain tied to the legacy pyramid model risk losing relevance as enterprise demand shifts toward AI-enabled, high-throughput, and platform-led delivery models.
The winners of this new economic model will master the SaS mindset: scaling through platforms, reusable digital assets, agentic automation, and AI-native delivery, effectively decoupling revenue and margin from workforce size.
The HFS Non-Linearity Index identifies the direction, momentum, and early contours of software-like economics in services
Headcount and revenue growth no longer signal competitiveness, but value creation and operating leverage do. Non-linearity, expressed through improvements in revenue per FTE and operating margin per FTE, is becoming the clearest indicator of whether a provider is pivoting to the SaS era.
The HFS Non-Linearity Index is designed to capture that trajectory. It provides a semi-annual, directional view of how service providers are evolving on two foundational dimensions of the SaS era:
- Value density, captured through YoY constant-currency changes in revenue per FTE.
- Operating leverage, captured through YoY changes in operating margin per FTE, adjusted for restructuring, volatility, and other factors that can temporarily distort margin performance.
This inaugural edition covers CY Q2 and Q3 2025 and establishes the starting point of a multi-year view. As the industry progresses through the SaS transition, movements in this index (to be published bi-annually) will reveal which providers are building toward software-like scalability and which remain bound to linear models.
These metrics, taken at face value, can be influenced by short-term operational shifts, demand mix, or organizational changes. What matters is their trajectory, not their quarterly noise. The index does not claim precision or finality, nor does it identify definitive winners yet. It is designed to be trend-oriented, comparable, grounded in the structural signals from provider performance, and make the pivot to non-linearity visible.
Ten service providers showing early non-linearity at scale
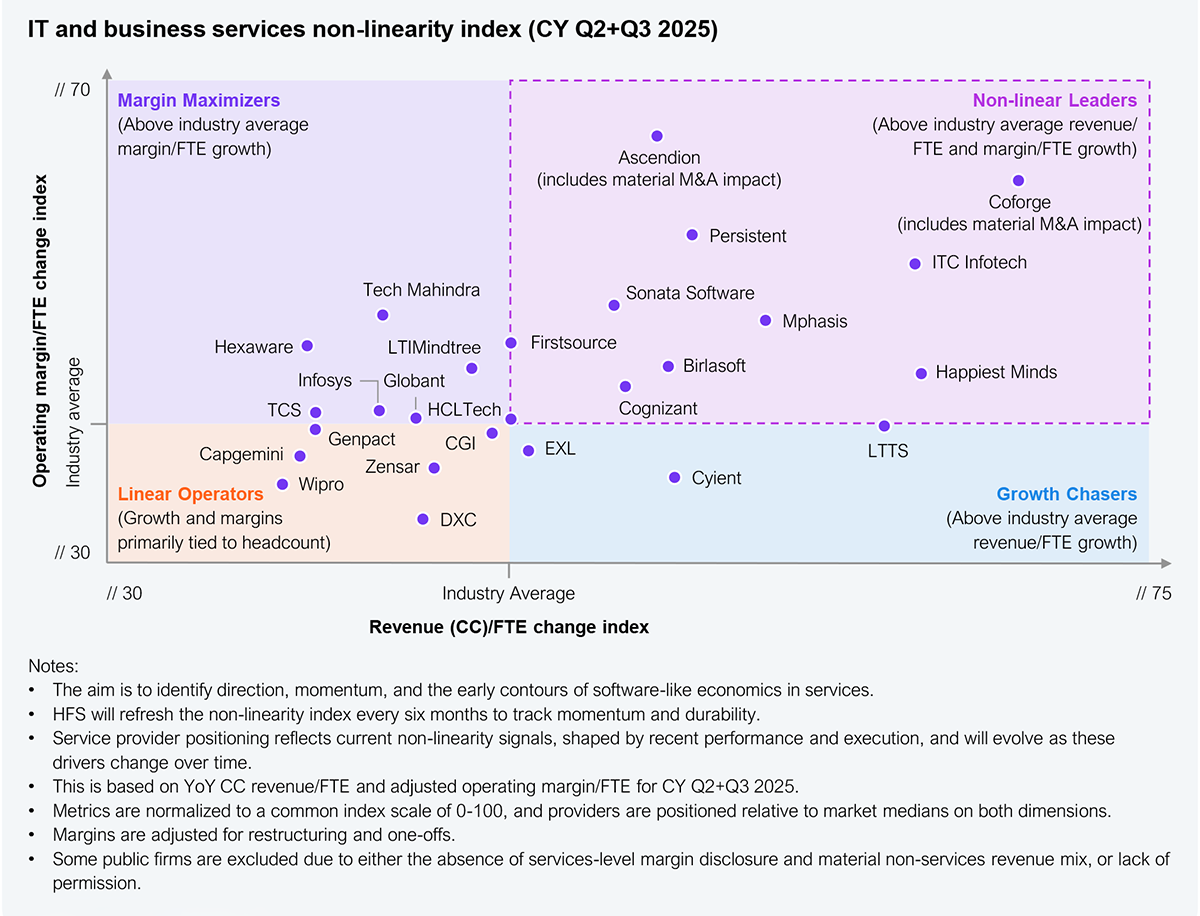
We identified ten service providers breaking free from the rest of the cohort based on their performance on the HFS Non-Linearity Index during CY Q2 and Q3 2025 (see Exhibit 2).
Exhibit 2: IT and business services provider performance in CY Q2 and Q3 2025
Source: HFS Research, 2026
Here’s what these 10 non-linear providers are doing differently (in alphabetical order):
- Ascendion reports continuous investments in its agentic engineering approach through the AAVA platform, an enterprise-wide GAIN AI adoption program, and METaI’s AI-enabled talent orchestration. In 2025, the company completed two meaningful acquisitions, UXReactor and Moody’s Northwest Consulting, which expanded its design, consulting, and engineering capabilities. Based on the timing and scale of these transactions, we believe these acquisitions contributed materially to the YoY changes observed in this cycle, alongside Ascendion’s focus on delivery automation and AI-led solutioning.
- Birlasoft reports a continued focus on delivery optimization initiatives, including utilization management, infrastructure consolidation, and operational efficiency programs. The company also highlights increasing use of cloud, data, and early generative AI (GenAI) capabilities within delivery workflows, including elements of its Cogito platform, to support productivity improvements and delivery consistency.
- Cognizant reports progress with its NextGen operating model, focused on simplifying internal operations, consolidating real estate, and increasing automation across corporate and delivery functions. It is also reinvesting these efforts into Data-Tech-AI led delivery and managed services, alongside greater use of standardized, platform-oriented solution constructs.
- Coforge reports an ongoing integration of Cigniti (merger approved) and related delivery and portfolio consolidation activities. It is also making continuous investments in its industry platforms, cloud and experience-led solutions, and automation-led managed services. Given the scale of the Cigniti merger and its integration during the assessment period, we believe that the M&A effects played a significant role in the YoY metrics observed in this cycle, complemented by Coforge’s broader modernization and platformization initiatives.
- Firstsource highlights its expanded use of AI-embedded, platform-led delivery models in areas such as digital collections and customer operations. The company cites automation, personalization engines, and workflow orchestration as mechanisms to improve delivery efficiency and scalability across select service lines.
- Happiest Minds emphasizes its digital-first delivery model, anchored in cloud, SaaS, and engineering services, and continued adoption of AI copilots and automation tools across development and testing workflows. The firm highlights its high digital mix and offshore-heavy structure as key elements shaping its delivery strategy.
- ITC Infotech reports a focus on platform-led managed services, expanded cloud and industry-solution offerings, and delivery optimization through automation and utilization management. AI-enabled enhancements across internal operations and solutioning are also part of its transformation agenda.
- Mphasis emphasizes the evolution of its Tribes and Squads model, deeper cloud and BFSI solution sets, and increased use of automation and AI in managed services and transaction workflows. Its platform partnerships and early hybrid delivery constructs (FTE+agent) are part of its operating model progression.
- Persistent reports continued scaling of its IP-led engineering strategy, including expansion of its GenAI platforms (AVA+), wider deployment of developer and tester copilots, and execution of more than 50 GenAI programs across clients. It emphasizes the reuse of digital assets and engineering automation as core levers of its delivery model.
- Sonata Software follows a platform-first and product-engineering led delivery approach with a strong emphasis on reusable digital assets, cloud-native architectures, and SaaS-aligned solution components. The firm views its high digital mix and standardized delivery constructs as central to the operating model.
The HFS Non-Linearity Index (CY Q2 and Q3 2025) shows early momentum but not widespread impact
Based on our analysis of more than 25 providers, the IT and business services industry is in the early stages of transitioning to a non-linear economic model (see Exhibit 3). Average revenue per FTE grew ~1% YoY, while operating margin per FTE improved ~3.5% YoY, indicating intention across the market, with structural movement concentrated in select areas.
Exhibit 3: Non-linear economic model in IT services is in its infancy
Source: HFS Research, 2026
Key takeaways:
1. AI is everywhere, but non-linearity is not
The industry is investing aggressively. Nearly every provider is deploying AI, automation, and platform-led delivery models, marking clear alignment with the SaS direction. The index shows meaningful dispersion in revenue per FTE and operating margin per FTE movements across providers, indicating that AI adoption is translating into non-linearity at different rates. Early structural gains are emerging, especially among firms with AI-native engineering or platform-first operating models.
2. AI is reshaping deal economics
Commercial non-linearity is gaining traction as AI becomes embedded into deal flow. Providers report a clear rise in AI-led deal components, agentic workflows, reusable IP, and platform-driven proposals. This is translating into stronger win rates, selective pricing resilience, and early signs of revenue-per-FTE improvement.
Providers are pursuing alternative non-linearity paths by passing AI-driven efficiency gains to clients in their commercial constructs (for instance, Hexaware), which can moderate near-term financial signals despite underlying productivity gains.
3. AI is emerging as a contributor to operating leverage
Margins are improving but still reflect a mix of structural and non-structural drivers. Operating margin per FTE improved more than value density (revenue/FTE) in this cycle, but a notable portion of this uplift is still tied to restructuring actions, footprint changes, or denominator effects. At the same time, more margin improvements are emerging from AI-enabled delivery efficiencies, internal automation, and platformization, suggesting an early blend of both short-term adjustments and genuine structural shifts.
Many providers indicated that AI-enabled delivery improvements contributed roughly 1–3 percentage points to their operating margin per FTE growth over the past two quarters. This is consistent with early-stage adoption, where task-level productivity is high while portfolio penetration remains low.
Implications for the enterprises, service providers, and investors
For enterprises
- Identify partners with early non-linearity signals, specifically those demonstrating measurable value density and operating leverage rather than relying on headcount scale.
- Expect hybrid delivery models (FTE+AI agents) to become standard, improving speed, cost, and quality of outcomes.
- Evaluate providers based on actual throughput gains, reusable asset strategies, and platform maturity, not marketing narratives.
- Prepare for evolving commercial models (outcome-based, usage-based, agent-assisted constructs) as SaS delivery becomes mainstream.
For service providers
- Non-linearity as the new performance benchmark, shifting attention from utilization and the pyramid shape to value per employee and leverage per employee.
- AI-led productivity to scale beyond pilots into enterprise-wide delivery models, internal operations, and client-facing platforms.
- Commercial differentiation from reusable IP, agentic workflows, and platform-first solutioning, not merely cost optimization.
- Restructuring-driven gains with diminishing signaling value; investors and clients will increasingly seek structural and repeatable proof of SaS capabilities.
- Semi-annual trendlines outweighing single-quarter spikes, making operating-model consistency critical.
For investors
- Focus on normalized, distortion-adjusted metrics to separate genuine productivity from restructuring or denominator effects.
- Early non-linearity signals indicate future scalability, margin durability, and competitiveness in the SaS era.
- Providers with strong IP, platform revenue, and agentic delivery models, positioned for higher valuation resilience over time.
- Track the direction and slope of multi-cycle performance, as this will reveal which providers are truly transitioning to software-like economics.
The Bottom Line: Non-linearity is no longer theoretical, but it’s not a slam-dunk either.
The HFS Non-Linearity Index for CY Q2 and Q3 2025 shows an industry in the early stages of a structural shift. The direction is clear: providers are investing heavily in AI, platforms, and reusable assets, and early signs of people-delinked value creation are emerging. This index will increasingly separate AI adoption from AI advantage.
However, non-linearity is not yet broad-based. For most providers, gains remain concentrated (by account, service line, or geography) and are still partially supported by restructuring and portfolio adjustments.
The next phase will determine the real leaders. Providers that can scale AI-enabled delivery, reusable IP, and agentic workflows enterprise-wide will begin to show sustained improvements in revenue per FTE and operating margin per FTE. Those that can’t risk remaining trapped in linear models despite the strong AI narratives. Enterprises can use this index as an early signal to identify partners that are better positioned to scale AI-enabled delivery beyond linear workforce growth.
Appendix: How the HFS Non-Linearity Index is constructed
Step 1: Performance data collation and verification
- We collected YoY constant-currency revenue per FTE and operating margin per FTE movements over the last two quarters (CY Q2 and Q3 2025) for each featured provider.
- Many providers submitted this data directly. For listed firms that didn’t, we used publicly disclosed earnings. Privately held providers that declined to share data are excluded from the analysis.
Step 2: Normalization of performance data
- To ensure comparability across providers, we computed and converted data for both metrics (YoY change in CC revenue per FTE and YoY operating margin per FTE) into a common, normalized index scale of 0–100, combining their performance in CY Q2 and Q3 2025.
- We then applied a relative adjustment factor to operating margin per FTE to account for elements that temporarily inflate margin performance (such as restructuring actions, multi-quarter volatility, denominator effects, or significant one-offs), so the index reflects structural, not cosmetic, operating leverage. Evidence across these elements was collected from public disclosures and earnings call transcripts over the last few quarters.
Step 3: Plotting of providers on the HFS Non-Linearity Index matrix
- Each provider’s revenue per FTE index and adjusted operating margin per FTE index were placed on a 2×2 matrix, with the market medians forming the horizontal and vertical cut lines.
- Providers landing in the top-right quadrant (above the median on both dimensions) are the Non-Linear Leaders for this cycle (CY Q2 and Q3 2025).