
Companies need easy access to the resources essential to their success. In the past that was timber, later coal and water for steam engines, more recently, skilled workers. The rise of AI means firms must now plan for future access to data center capacity as AI demand absorbs new supply before it even opens.
Globally capacity will double between now and 2030. In that period India rises from fifth by capacity, to third (over taking the UK’s current top 3 position) – behind only the US and China. One thing we should note is China’s capacity may be under reported since the data used reflects internationally tracked markets and is likely to underestimate the domestic fleet. Even so, US dominance is wildly ahead of its economic power (as reflected by comparative GDP).
Malaysia’s scale is Singapore spillover. Singapore’s power and land constraints pushed hyperscalers across the causeway to Johor, where cheap land, available power, and a fast-track special economic zone have drawn massive commitments from Microsoft, Google, AWS, ByteDance and Nvidia. Johor alone now has ~1.1 GW live and a ~3 GW pipeline, about half of everything under construction in Southeast Asia.
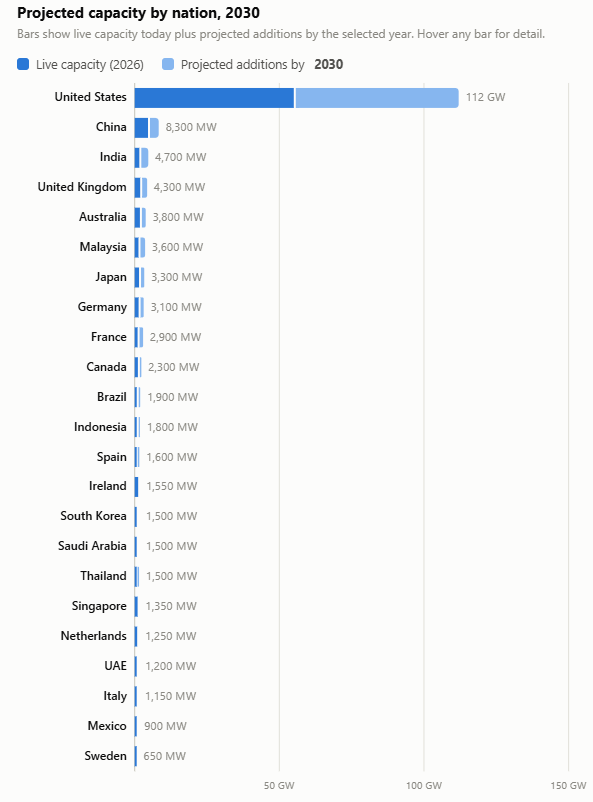
Australia is a demand-side story: it’s a mature cloud market where AI is supercharging an already large hyperscaler footprint in Sydney and Melbourne, backed by political stability, data-sovereignty rules that keep workloads onshore, abundant land and renewables, and deep infrastructure capital (an A$24bn AirTrunk deal for example). Sydney’s pipeline grew ~65% in the past year to over 2 GW. Malaysia is building for the region’s AI workloads, Australia largely for its own.
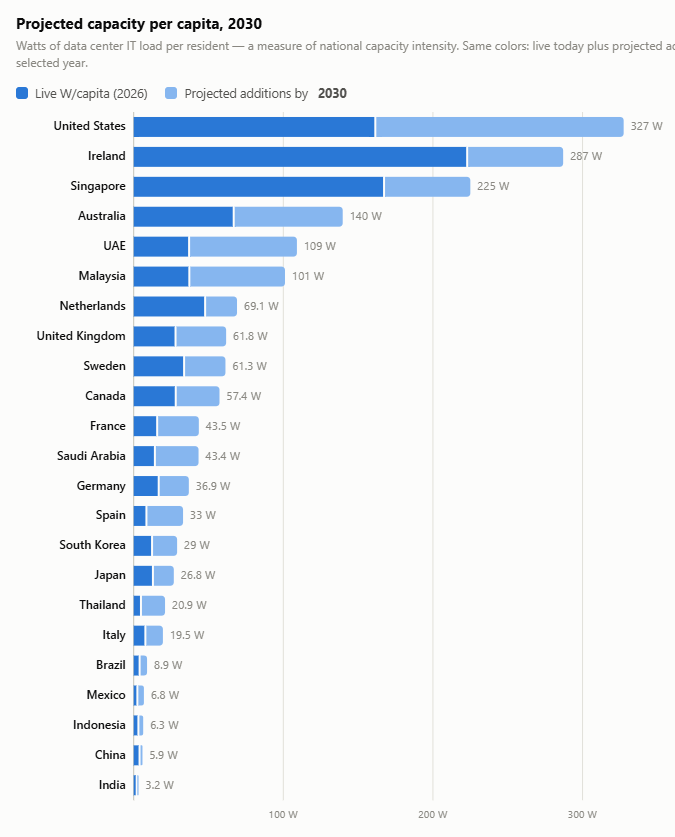
When we look at per capita capacity new outliers emerge. For live capacity vs population, Ireland is the global No1 (Singapore is second pushing the US into third). Data centers now consume roughly a fifth of Ireland’s electricity supply – the highest share of any country in the world. It is home to many tech firms’ European HQs and services European needs beyond its own borders. By 2030 the US takes top place with 320 W per head (while China notably languishes on 5.9W per head, on the available data). In this context India is also a poor performer with just 3.2 MW per head of population. The UK – at the same point, will be providing 61.8 W per head.
The bottom line: Legacy hubs an enterprise would instinctively pick (Dublin, Singapore, Amsterdam, Frankfurt) are hitting grid ceilings. Growth is shifting to power-rich second cities: Johor rather than Singapore, Madrid rather than Amsterdam, Texas rather than Northern Virginia. Your decisions should follow where the megawatts will actually get powered, not where capacity sits today. Be skeptical of announced gigawatts (historically well under half get built) but take pre-leasing seriously: AI demand is absorbing new supply before it opens, meaning the practical risk for an enterprise is not overpaying but being unable to secure capacity at all. Geography, energy policy, and grid queues now shape your infrastructure map more than your own demand forecast does.
Methodology & sources
Capacity is IT load in megawatts for commercially tracked colocation and hyperscale facilities — enterprise on-premise server rooms are excluded. Projections interpolate between today’s live capacity and a 2030 estimate that combines capacity under construction with a risk-discounted share of announced pipelines (announced gigawatts historically convert to energized capacity at well under half). China’s facility count and capacity reflect internationally tracked markets and understate the domestic fleet. Saudi Arabia and UAE projections follow official national targets rather than gross announcements.
Sources: Data Center Map via Visual Capitalist (facility counts, Feb 2026); FERC State of the Markets (US, Mar 2026); Wood Mackenzie US pipeline tracker (Q1–Q2 2026); Cushman & Wakefield APAC H1 2026 and EMEA H2 2025 market updates; JLL Global Data Center Outlook 2026 (103 GW → 200 GW by 2030); Vision2030.ai / SDAIA and IDCA (Middle East); national market reports for Brazil, Mexico, India, and Australia. Figures are triangulated estimates, not a licensed database extract. Per-capita figures divide national IT load by 2025 UN/World Bank population estimates (watts per resident).

