This HFS Point of View is for service provider strategy leaders, enterprise sourcing executives, and investors tracking which providers are decoupling growth from headcount through Services-as-Software™.
When we published the first edition of this report in early 2026, headcount remained the dominant driver of growth across much of the IT and business services industry. We argued that the industry’s long-standing reliance on linear growth was beginning to face meaningful pressure. Two additional quarters of data have strengthened that signal, although the shift remains concentrated among a subset of providers.
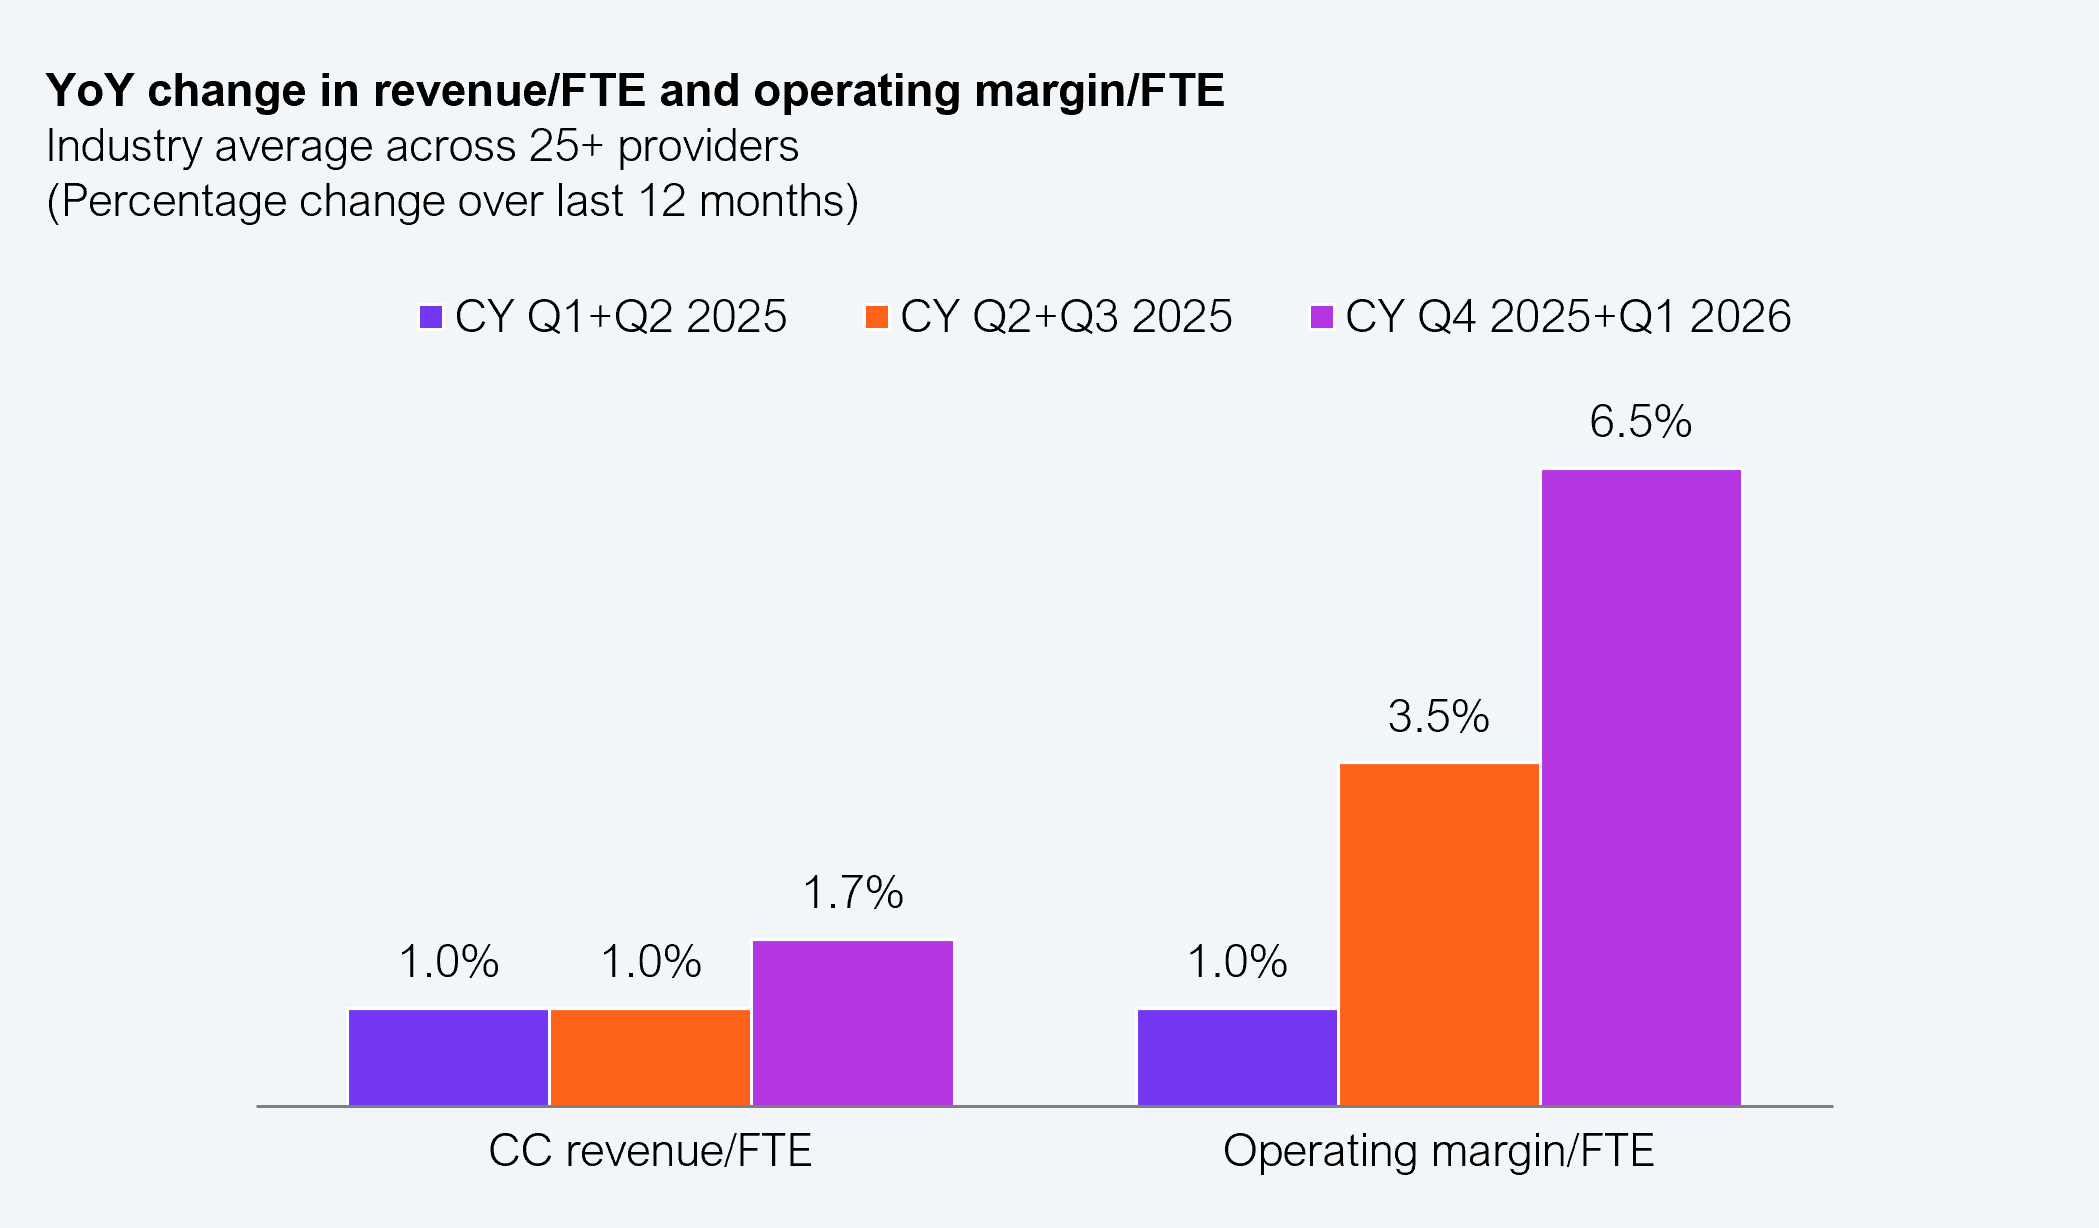
In our first edition, average revenue per FTE grew ~1% YoY and the operating margin per FTE improved ~3.5% YoY. Two quarters later, in CY Q4 2025 and Q1 2026, those figures climbed to ~1.7% and ~6.5%, respectively, as per our analysis of more than 25 major service providers. This trend gave additional evidence that some providers are beginning to decouple value creation from workforce expansion. Within this shift, we identified six providers that demonstrated sustained non-linear growth over the past four quarters and five additional providers that are building momentum toward non-linearity faster than the broader market.
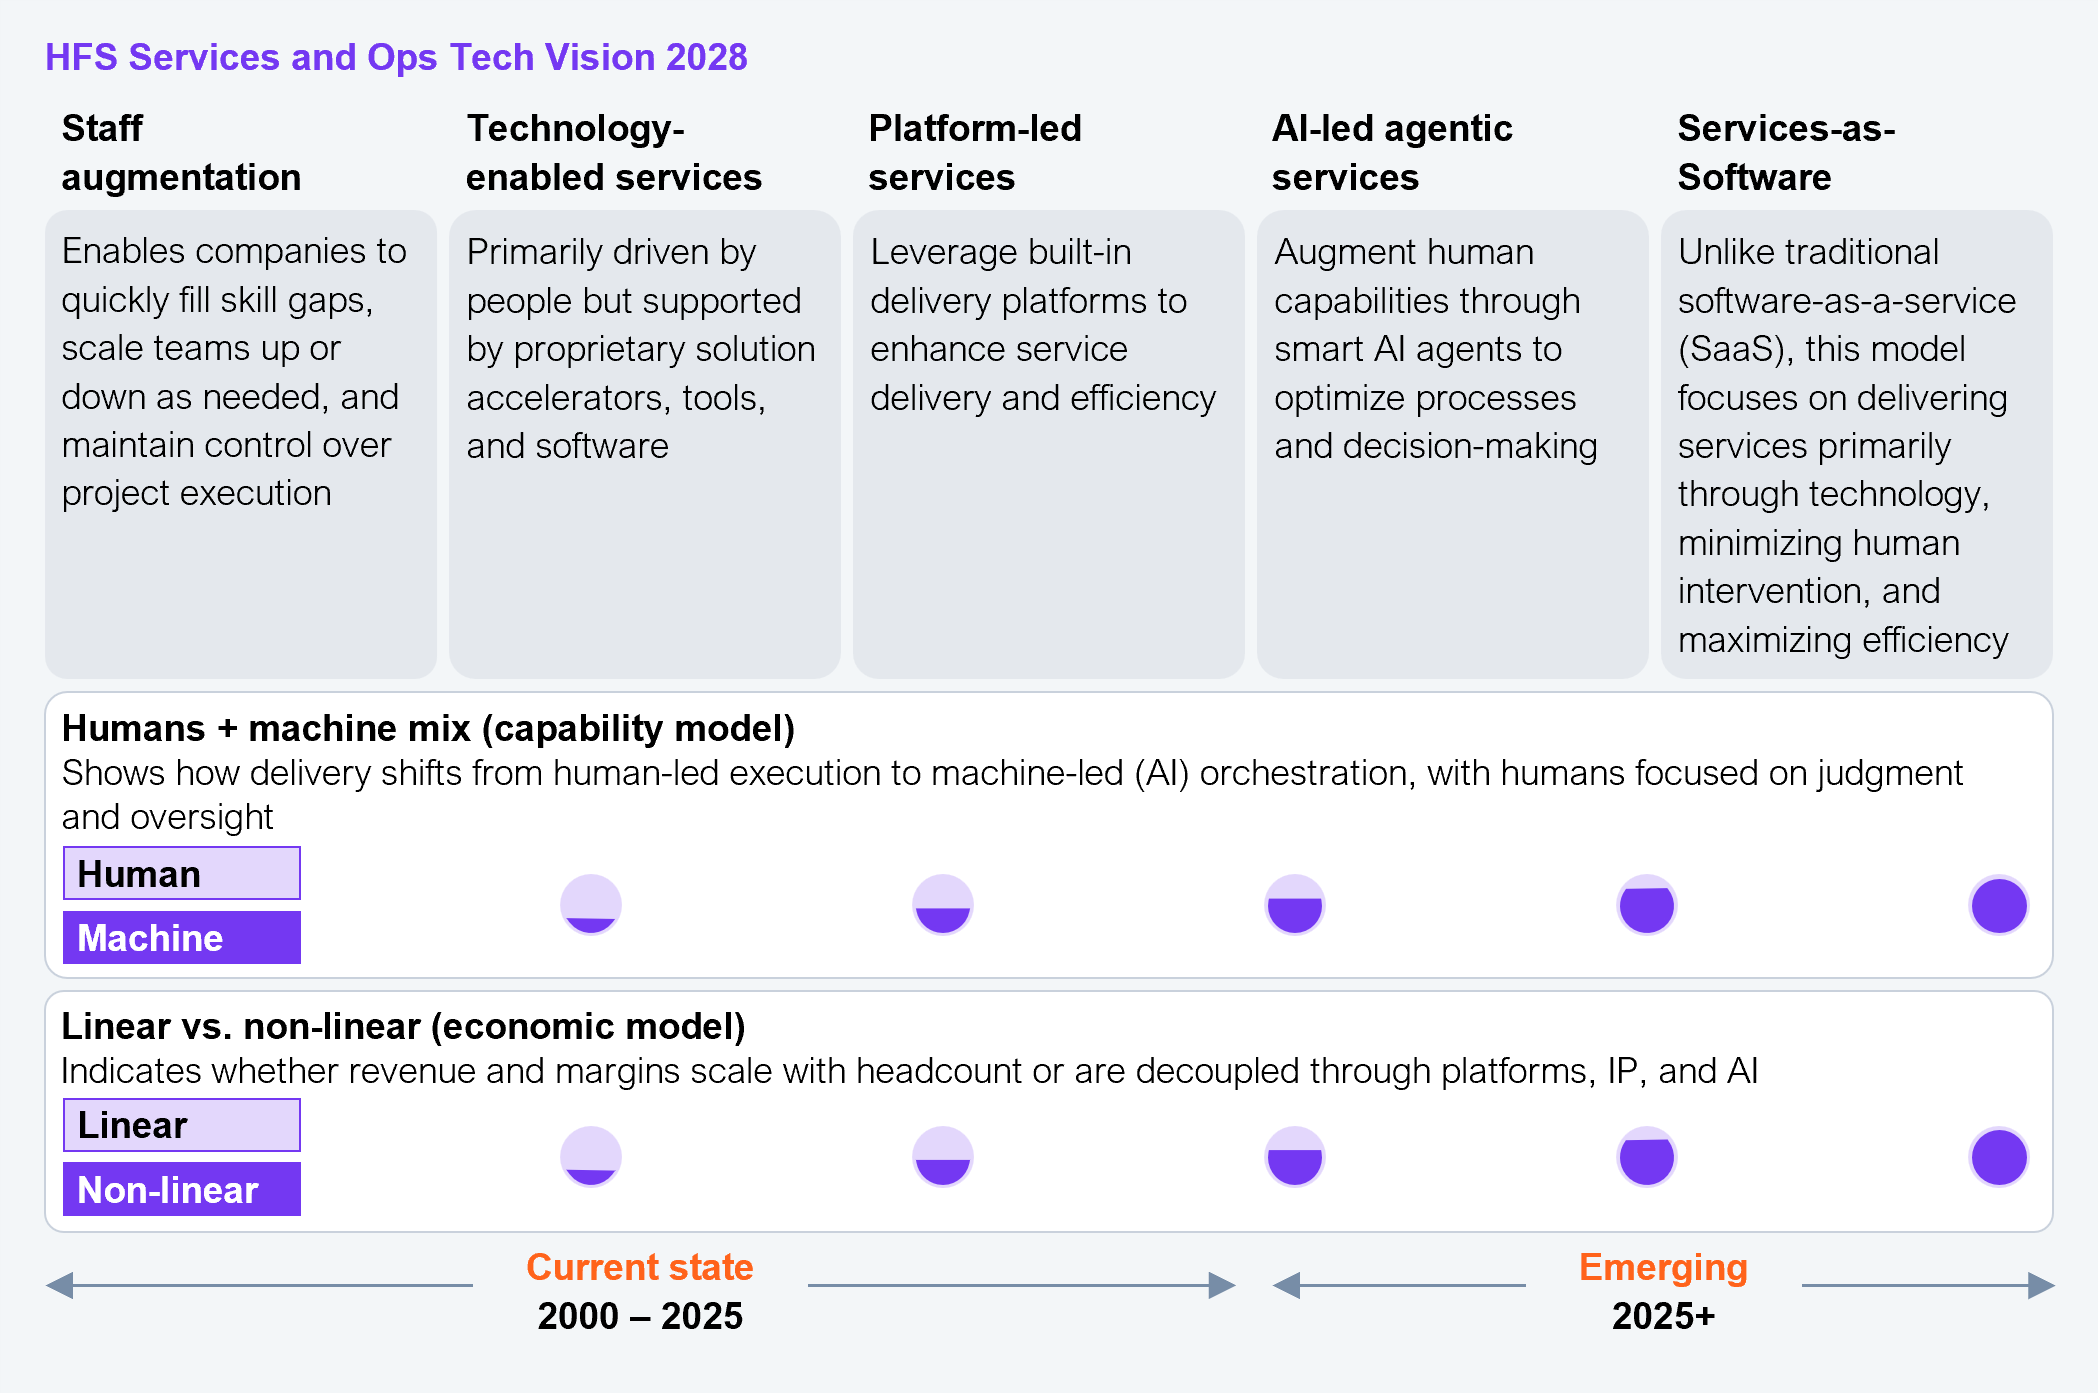
We view these developments as early indicators of what we call Services-as-Software, an operating and delivery model defined not by how many people a provider can deploy, but by how much value each person, platform, and AI agent can generate. In the model providers build once, deploy many, and scale value through software-like mechanisms rather than linear headcount growth (see Exhibit 1). This second edition continues tracking how the transition has progressed and which providers are turning the Services-as-Software model into practice.
Exhibit 1: HFS’ Services Tech Vision highlights a shift to a non-linear economic model enabled by adopting Service-as-Software
Source: HFS Research, 2026
While still in its early stages, the shift appears increasingly structural rather than simply another wave of technology adoption
Some providers are already beginning to scale without scaling people, generating the early signs of non-linearity. Others remain reliant on traditional pyramid economics and may find it harder to compete if enterprise buying continues to shift toward outcome-based and platform-led delivery. Providers that successfully internalize the Services-as-Software mindset are likely to be better positioned to pull ahead. By scaling through platforms, reusable digital assets, agentic automation, and AI-native delivery, they are increasingly able to decouple revenue and margin growth from workforce expansion, an advantage that could become increasingly difficult for late movers to replicate.
The HFS Non-Linearity Index identifies the direction, momentum, and early contours of software-like economics in services
Headcount growth alone is becoming a less reliable indicator of competitiveness than value creation and operating leverage. Non-linearity, expressed through improvements in revenue per FTE and operating margin per FTE, is emerging as a useful indicator of whether providers are progressing toward a Services-as-Software model.
The HFS Non-Linearity Index is designed to capture that trajectory. It provides a semi-annual, directional view of how service providers are evolving on two foundational dimensions of the Services-as-Software era:
- Value density, captured through YoY constant-currency changes in revenue per FTE
- Operating leverage, captured through YoY changes in operating margin per FTE, adjusted for restructuring, volatility, and other factors that can temporarily distort margin performance
This second edition covers CY Q4 2025 and Q1 2026. As the industry progresses through the Services-as-Software transition, movements in this index (published bi-annually) will reveal which providers are building toward software-like scalability and which remain bound to linear models.
These metrics, taken at face value, can be influenced by short-term operational shifts, demand mix, or organizational changes. What matters is their trajectory, not their quarterly noise. The index does not claim precision or finality, nor does it identify definitive winners yet. It is designed to be trend-oriented, comparable, grounded in the structural signals from provider performance, and make the pivot to non-linearity visible.
Eleven service providers showing early non-linearity at scale
We identified eleven service providers outperforming the market on the HFS Non-Linearity Index during Q4 2025 and Q1 2026 (see Exhibit 2). Six of these leaders (Ascendion, Coforge, Firstsource, ITC Infotech, Mphasis, and Persistent) have been consistently driving non-linear growth in the last four quarters.
Exhibit 2: Most providers still scale on headcount; only a handful decouple both growth and margins to lead non-linearity
Notes:
- The aim is to identify direction, momentum, and the early contours of software-like economics in services.
- HFS will refresh the non-linearity index every six months to track momentum and durability.
- Service provider positioning reflects current non-linearity signals, shaped by recent performance and execution, and will evolve as these drivers change over time.
- This is based on YoY CC revenue/FTE and adjusted operating margin/FTE for CY Q4 ’25 + Q1 ’26.
- Metrics are normalized to a common index scale of 0–100, and providers are positioned relative to market medians on both dimensions.
- Margins are adjusted for restructuring and one-offs.
- Some public firms are excluded due to either the absence of services-level margin disclosure and material non-services revenue mix, or lack of permission.
Source: HFS Research, 2026
Here’s what these 11 non-linear providers are doing differently (in alphabetical order):
- Accenture reports that it is deliberately decoupling revenue from headcount, pointing to record bookings (over $20 billion in Q1 2026) against broadly flat headcount (~786,000). The company attributes its momentum to growing non-FTE revenue through AI-native acquisitions such as Faculty, Ookla (generated $231 million from just 430 employees), and LearnVantage; scaling advanced-AI bookings and revenue (~$2.2 billion and $1.1 billion in Q4 2025); greater use of proprietary platforms and managed services, led by application and infrastructure managed services; and internal AI enablement through large-scale training and embedded AI tooling, along with a deliberate rebuild of its lower-cost entry-level talent pyramid.
- Ascendion reports that the agentic engineering model, anchored by the AAVA platform, the GAIN AI adoption framework, and MeTAL talent orchestration, is increasingly visible in its delivery economics. The company cites internal AI enablement, talent-orchestration efficiency, and AAVA-driven engineering productivity as the main drivers. However, as much of the AI-generated savings are now shared with clients, the reported margin gains have moderated. With AI-influenced opportunities now accounting for ~60% of its pipeline, Ascendion continues to grow well above the market.
- Coforge reports that it is decoupling growth from hiring, with revenue rising far faster than headcount from 2025. The company attributes this to embedding AI across its own delivery and back-office operations, pricing AI-led “mod squads” (hybrid AI delivery pods) on outcomes rather than hours and shifting toward higher-value agentic work. It also cites low industry attrition, high utilization, and integration synergies of large acquisitions such as Cigniti as key factors supporting its high exit-quarter operating margin and improving per-employee value.
- EXL reports that it is repositioning from a labor-led operations firm to a global data and AI company, with growth concentrated in higher-value AI work rather than headcount. The company points to its data and AI-led business, which accounts for ~60% of its revenue and grew ~27% YoY, even as its traditional Digital Operations book declines, alongside expanding operating margins. EXL attributes this shift to proprietary agentic AI-native platforms such as EXLdata.ai, productized platform-based solutions that combine operations, data, and AI, a growing partner ecosystem (NVIDIA, AWS), and investment in AI-native talent.
- Firstsource reports that it has moved beyond AI-embedded, platform-led delivery toward what it now calls “Intelligence That Operates.” This is a full-stack model in which it designs, builds, and operates clients’ intelligent operations end to end under a single, outcome-linked contract. In 2025, it cited automation, personalization engines, and workflow orchestration as efficiency levers in areas such as digital collections and customer operations. The company also introduced delivery via Kairos, its operating system for AI-native operations, which combines its 25 years of domain expertise with agentic AI. The commercial model is shifting as its pricing increasingly underwrites outcomes rather than seats. Firstsource registered FY26 revenue growth of ~20% while only increasing headcount growth by ~4.5%.
- Genpact highlights that it is repositioning itself from a labor-led operations company to an agentic, AI-led one. It is rotating existing clients from traditional digital operations to agentic operations. Key drivers include: productizing its domain expertise into reusable IP such as agentic finance solutions for processes such as accounts payable and record-to-report; rewiring its commercial model away from headcount-based pricing toward fixed-fee, consumption, and outcome-based contracts; building strategic alliances such as with Google Cloud to build agentic solutions for the CFO office and embedding the same agentic tooling into its own delivery.
- ITC Infotech has ambitions to build towards the Services-as-Software model. In the last edition, we noted its platform-led managed services, automation, and utilization-driven delivery. This year, it has pushed its agentic AI agenda further by launching the K-Fabric agentic orchestration framework, and OmniFabrik to automate IT operations, opening Digital and AI Experience Centers in Bengaluru and Kolkata and an AI Studio in Pune in April 2026, and forming an alliance with InsureMO to extend agentic delivery into insurance.
- LTM reports that it is repositioning from an IT services provider to a “business creativity partner,” aiming to own client outcomes rather than only supply capability. Central to this is BlueVerse, its AI ecosystem that brings together infrastructure and tools, a growing marketplace of prebuilt agents and solutions, domain-specific SLMs, expanded partnerships, and talent initiatives to give engagements a common AI foundation.
- Mphasis reports that it orchestrates delivery through NeoIP, a platform for modernization, automation, and AI-driven transformation, and is evolving beyond IT-centric work toward an “Everything-as-a-Platform” model of reusable capability. This is deepened by its acquisition of Theory and Practice and its Continuum AI decision-intelligence platform. This shift is mostly reflected in client demand, with the majority of new deals and roughly two-thirds of its pipeline now AI-led.
- Persistent reports that its strategy rests on three pillars: engineering hyperproductivity, business hyperproductivity, and enterprise AI. These capabilities are delivered through proprietary platforms led by SASVA, which the company describes as moving teams from individual productivity to enterprise-scale execution. It is embedding agentic accelerators into modernization work, but there is little sign of outcome-based pricing.
- TCS reports that it is scaling AI quickly, but its per-employee gains in this cycle are driven more by cost discipline than by AI. The company is positioning itself around an agentic enterprise shift, moving clients from using AI as a tool toward agentic operations with defined outcomes. Its annualized AI revenue crossed $2.3 billion in Q1 2026, supported by new partnerships with OpenAI, AMD, and ABB and a large base of AI-skilled staff. But that AI line is still a small share of a $30 billion company. With revenue broadly flat, its record margins and improved per-head metrics are driven by pyramid optimization, utilization, and a reduced headcount rather than a clean AI-led break between revenue and people.
Everyone is deploying AI, but few are bending the curve
Based on our analysis of more than 25 providers, early signs of non-linearity are becoming more visible across the market, although structural progress remains concentrated among a relatively small group of providers (see Exhibit 3). Average revenue per FTE grew ~1.7% YoY and the operating margin per FTE improved ~6.5% YoY in the past year, indicating intention across the market, with structural movement concentrated in select areas.
Exhibit 3: The operating margin per FTE has accelerated over the last three reporting periods
Source: HFS Research, 2026
Key takeaways:
Nearly every provider is deploying AI, automation, and platform-led delivery, but the index shows wide dispersion in how far this translates into revenue- and margin-per-FTE gains. AI-led work is growing faster than traditional delivery in many providers’ portfolios. The new and renewed contracts increasingly carry AI components, agentic workflows, and reusable IP, lifting win rates and early revenue-per-FTE. While AI adds ~1–3 points to the operating margin per FTE; much of the headline uplift still reflects restructuring, M&A, and headcount cuts rather than pure AI. With AI deflation now a revenue headwind, this remains early-stage non-linearity, concentrated among a few AI-native, platform-led and outcome-led firms.
Enterprise expectations stay high, clearest in how buyers expect to pay. Their preferences are shifting toward outcome-, platform-, and consumption-based pricing, while FTE/effort-based and fixed fee/milestone-based pricing is expected to shrink (see Exhibit 4). This changes the incentive structure: providers that can underwrite outcomes and commercialize reusable, agentic assets gain share, while those anchored to effort-based billing face pressure on growth and margin. This pricing shift will likely accelerate operating model changes among providers.
Exhibit 4: Buyers now want to pay for outcomes, so the model is shifting from effort-based pricing to outcome, consumption, and platform approaches
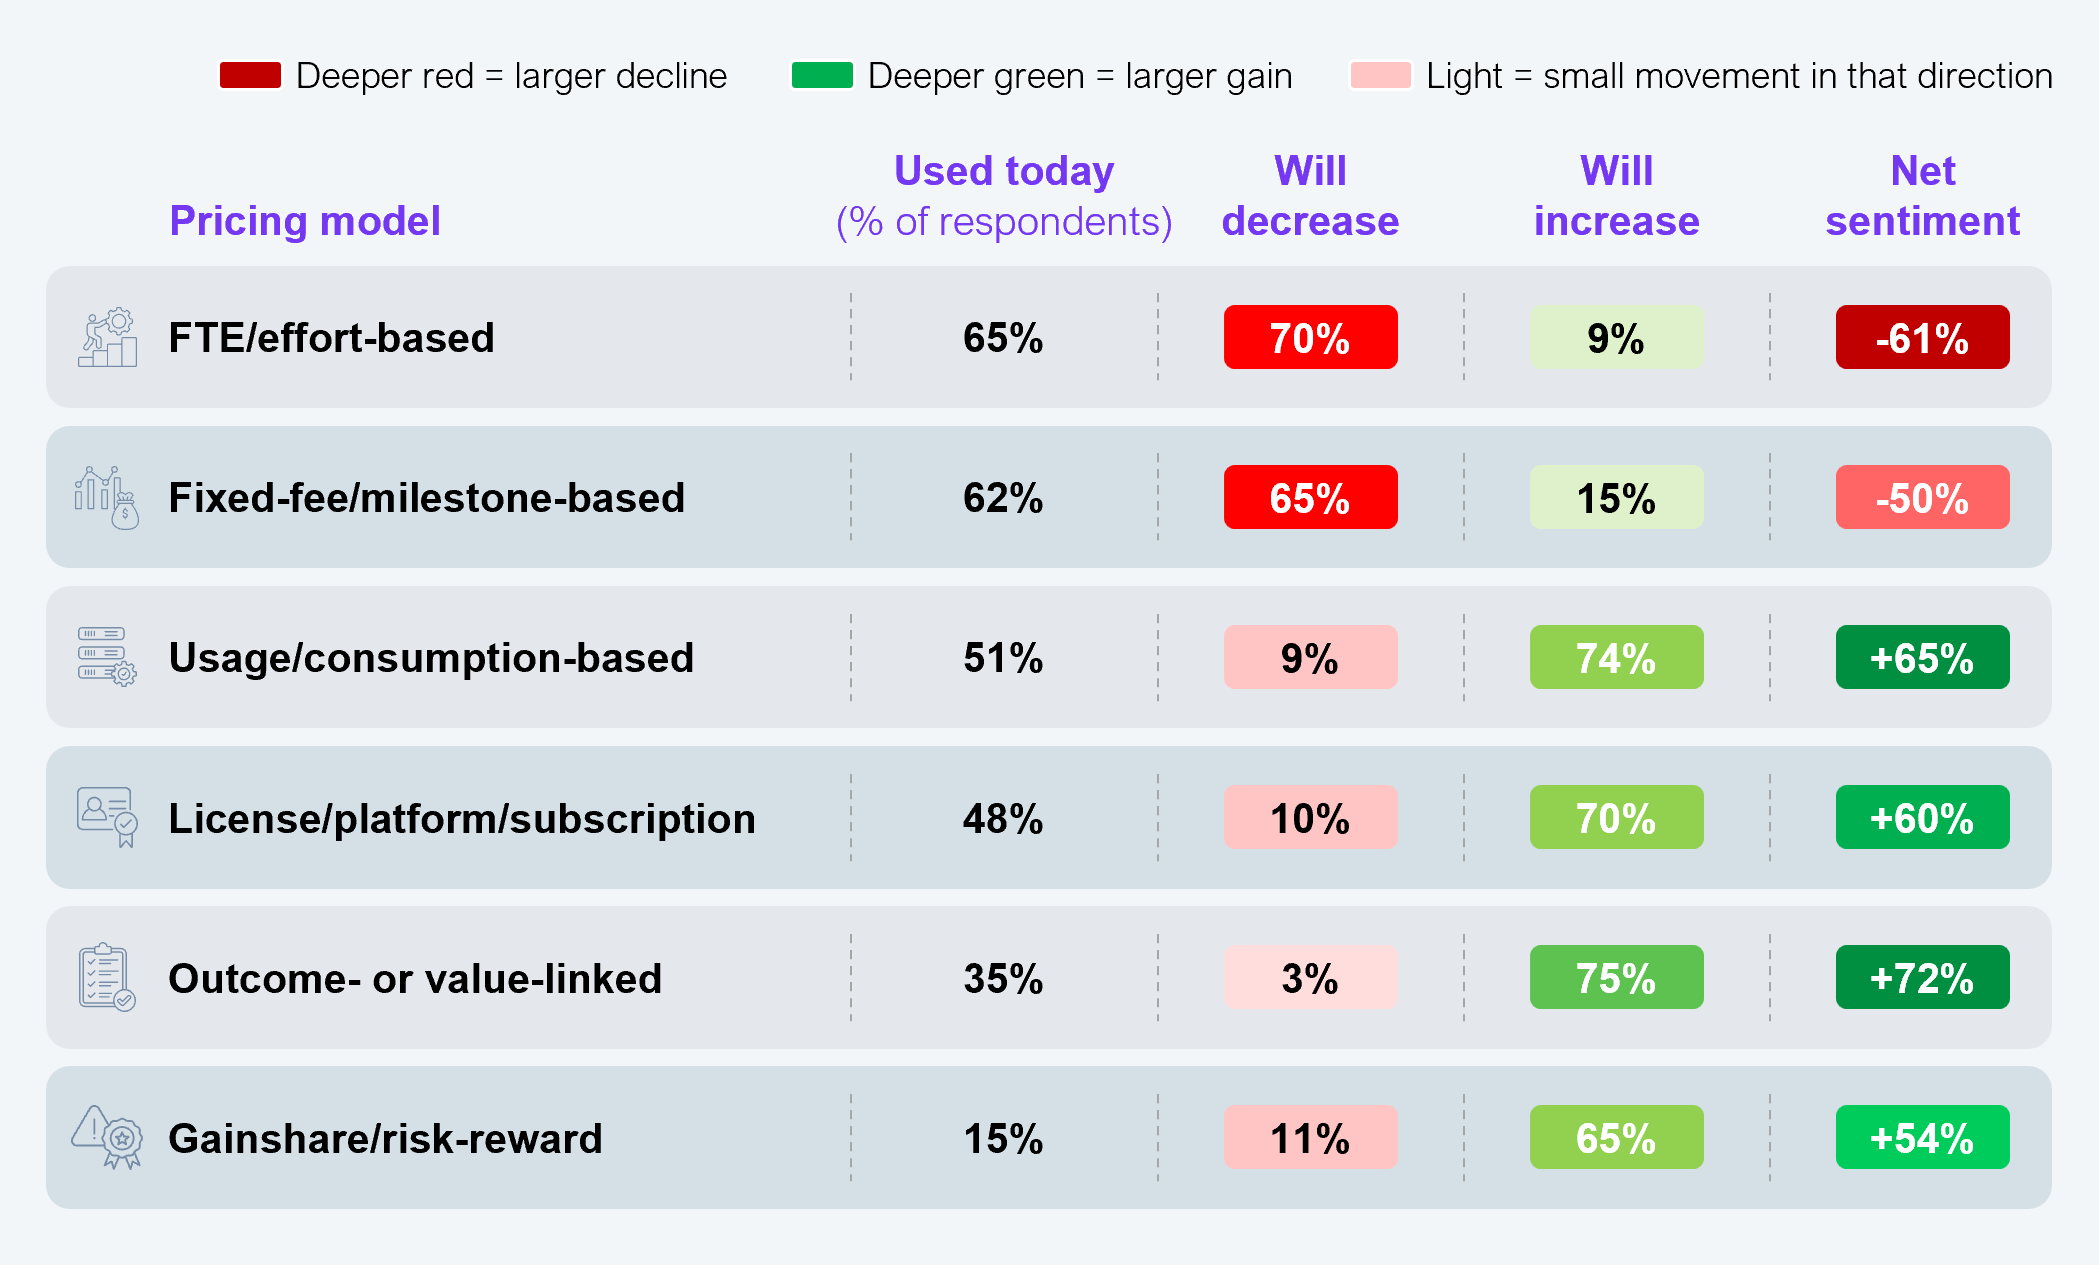
Question: How do you expect each pricing mechanism to change over the next 2 years?
Sample size: 202 senior enterprise leaders from organisations with $1B+ in annual revenue
Source: HFS Research Enterprise Pulse Study, 2026
While AI investment is widespread, only a few providers have translated it into consistent improvements in revenue density and operating leverage. This is a capability divide, not a spending one. The gap widens even as investment rises because the differentiator is no longer AI deployment itself but converting it into a new commercial and delivery model. As enterprises are shifting their pricing preferences, that divide will increasingly decide who gains share, defends margin, or gets repriced. This is a defining trend to track, with leaders and laggards likely to separate further.
Implications for the enterprises, service providers, and investors
For enterprises
- Identify partners with early non-linearity signals, specifically those demonstrating measurable value density and operating leverage rather than relying on headcount scale.
- Expect hybrid delivery models (FTE+AI agents) to become standard, improving speed, cost, and quality of outcomes.
- Evaluate providers based on actual throughput gains, reusable asset strategies, and platform maturity, not marketing narratives.
- Prepare for evolving commercial models (outcome-based, usage-based, agent-assisted constructs) as Services-as-Software delivery becomes mainstream.
For service providers
- Non-linearity as the new performance benchmark, shifting attention from utilization and the pyramid shape to value per employee and leverage per employee.
- AI-led productivity to scale beyond pilots into enterprise-wide delivery models, internal operations, and client-facing platforms.
- Commercial differentiation from reusable IP, agentic workflows, and platform-first solutioning, not merely cost optimization.
- Restructuring-driven gains with diminishing signaling value; investors and clients will increasingly seek structural and repeatable proof of SaS capabilities.
- Semi-annual trendlines outweighing single-quarter spikes, making operating model consistency critical.
For investors
- Focus on normalized, distortion-adjusted metrics to separate genuine productivity from restructuring or denominator effects.
- Early non-linearity signals indicating future scalability, margin durability, and competitiveness in the Services-as-Software era.
- Providers with strong IP, platform revenue, and agentic delivery models, positioned for higher valuation resilience over time.
- Track the direction and slope of multi-cycle performance, as this will reveal which providers are truly transitioning to software-like economics.
The Bottom Line: Non-linearity is becoming a core criterion, and enterprises now want proof.
Non-linearity is gaining criticality as a theme. What was an emerging signal a year ago is now something buyers actively weigh, and the shift is strengthening over time. Increasingly, enterprises are looking beyond AI narratives and asking providers to demonstrate measurable business outcomes. They are looking for tangible proof that a provider can bring delivery models that meaningfully reduce their cost of operations, deploy fewer people per unit of output, and pass real, measurable savings back to them rather than simply absorbing the productivity internally.
These findings suggest that enterprises must now evaluate providers based on their ability to demonstrate non-linearity with hard evidence, ask them to distinguish genuine AI-driven gains from cost-cutting or M&A effects, and favor partners willing to tie commercials to outcomes rather than headcount. Because only a relatively small group of providers currently demonstrate sustained non-linearity, the ability to show actual, people-delinked value will increasingly separate the partners worth scaling from those still telling a compelling AI story without evidence to support it.
Appendix: How the HFS Non-Linearity Index is constructed
Step 1: Performance data collation and verification
- We collected YoY constant-currency revenue per FTE and the operating margin per FTE movements over the last two quarters (CY Q4 2025 and Q1 2026) for each featured provider.
- Many providers submitted this data directly. For listed firms that didn’t, we used publicly disclosed earnings. Privately held providers that declined to share data are excluded from the analysis.
Step 2: Normalization of performance data
- To ensure comparability across providers, we computed and converted data for both metrics (YoY change in CC revenue per FTE and YoY operating margin per FTE) into a common, normalized index scale of 0–100, combining their performance in CY Q4 2025 and Q1 2026.
- We then applied a relative adjustment factor to the operating margin per FTE to account for elements that temporarily inflate margin performance (such as restructuring actions, multi-quarter volatility, denominator effects, or significant one-offs), so the index reflects structural, not cosmetic, operating leverage. Evidence across these elements was collected from public disclosures and earnings call transcripts over the last few quarters.
Step 3: Plotting of providers on the HFS Non-Linearity Index matrix
- Each provider’s revenue per FTE index and adjusted operating margin per FTE index were placed on a 2×2 matrix, with the market medians forming the horizontal and vertical cut lines.
- Providers landing in the top-right quadrant (above the median on both dimensions) are the Non-Linear Leaders for this cycle (CY Q4 2025 and Q1 2026).