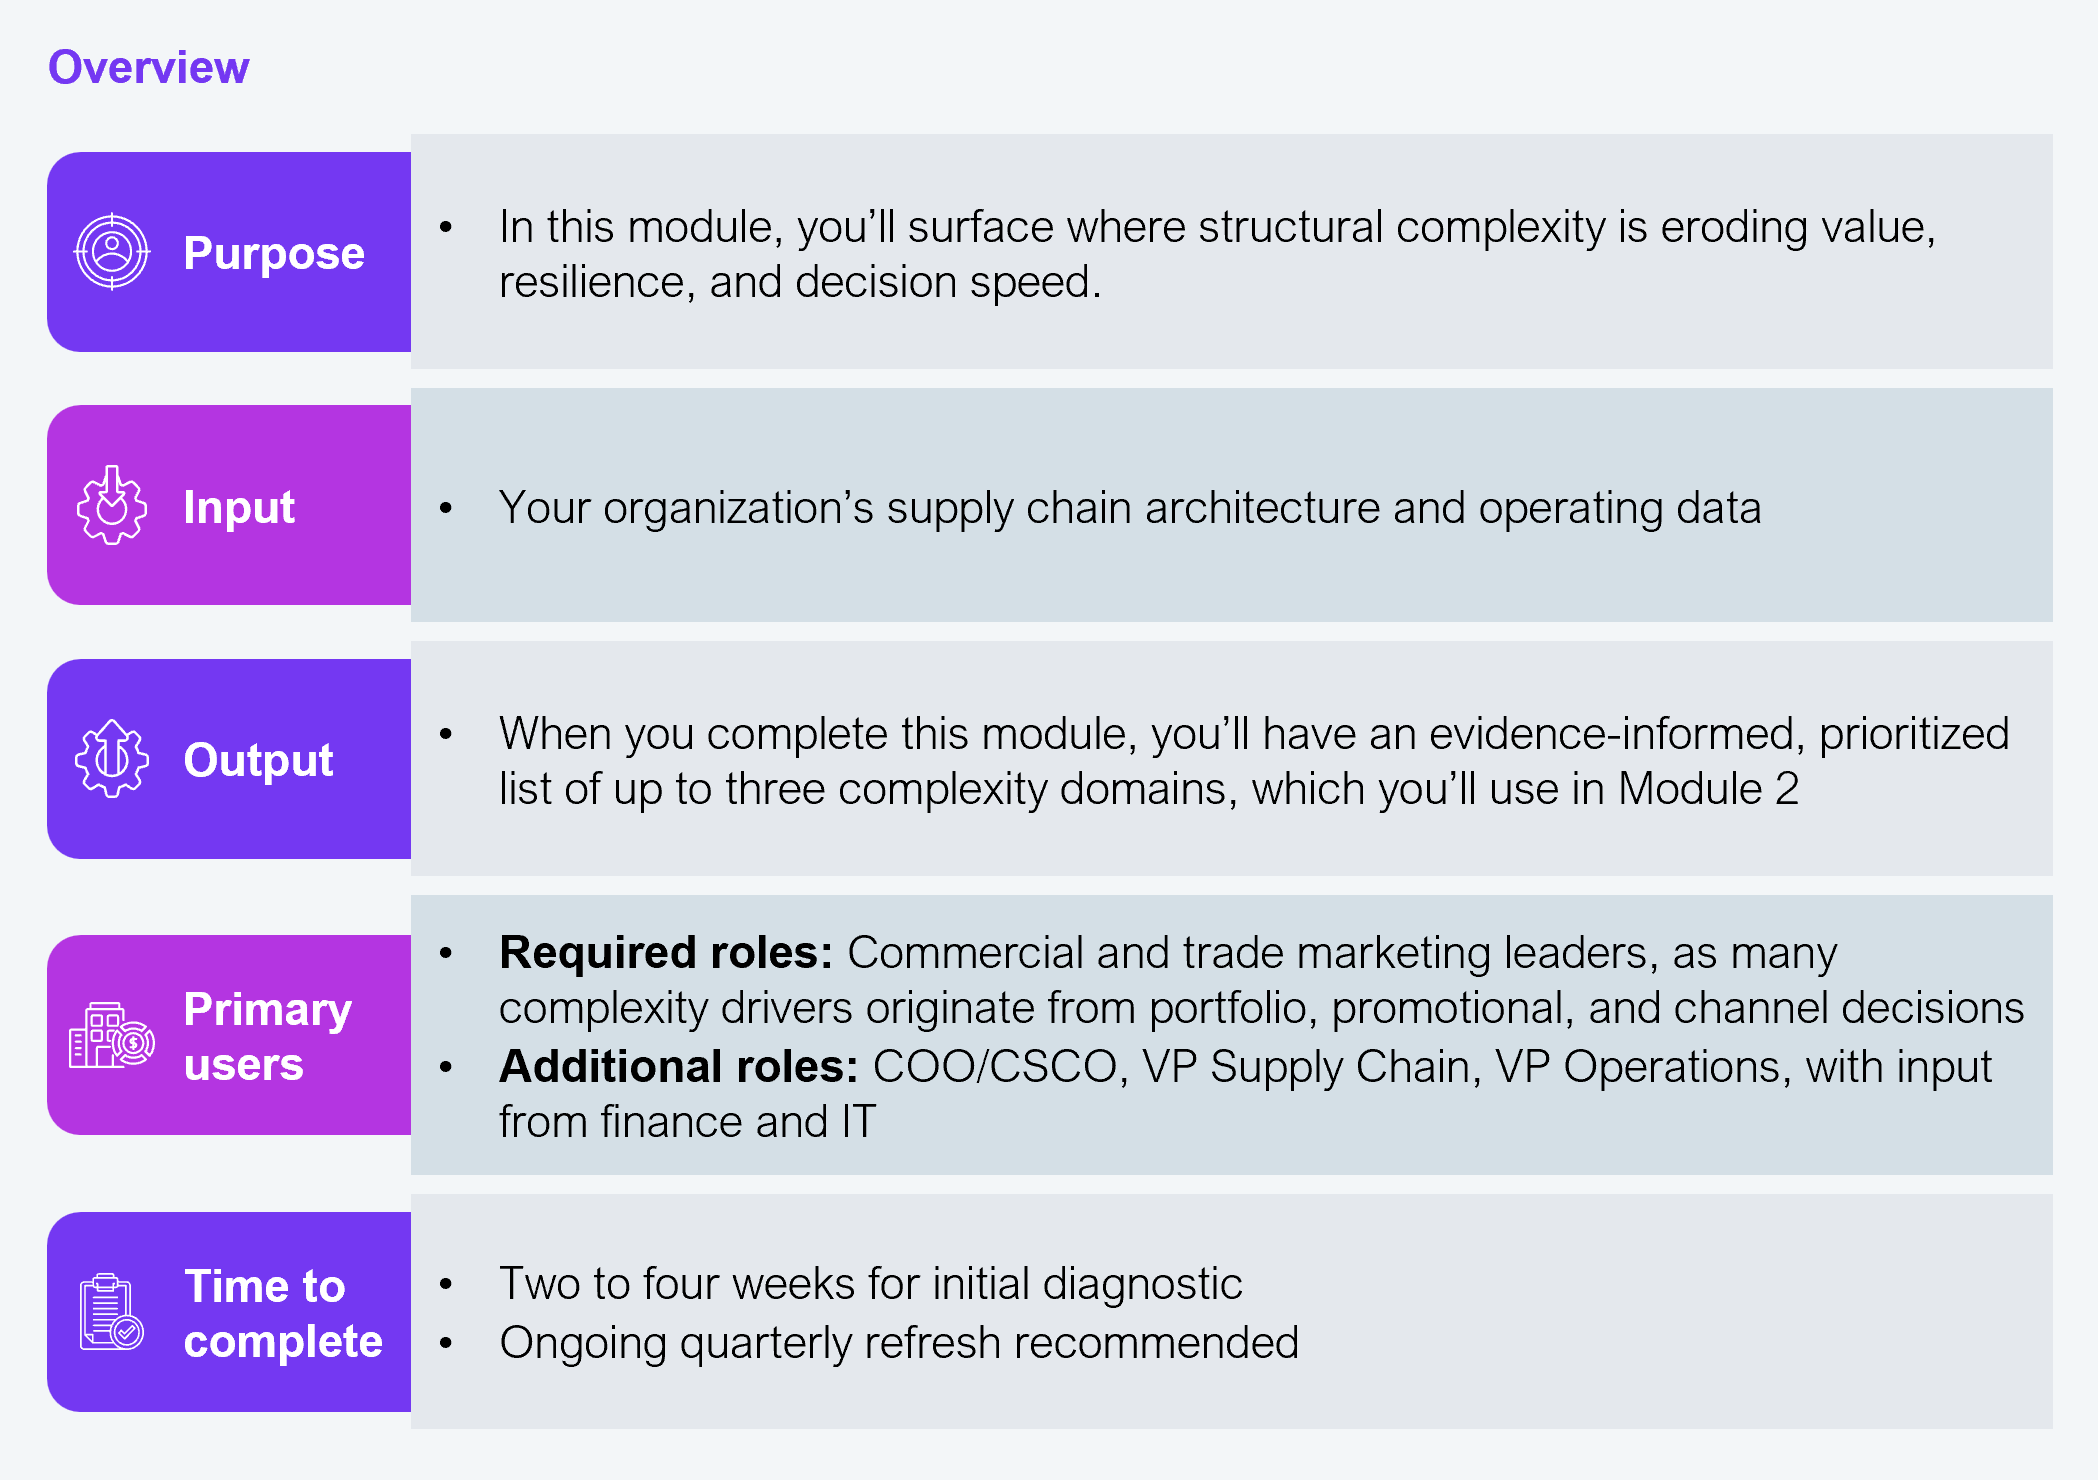
This Enterprise Asset is for COOs (Head of GBS), chief supply chain officers, and the cross-functional leadership teams spanning commercial, trade marketing, finance, and operations. These teams are responsible for supply chain architecture decisions in consumer goods companies.
The problem this solves
Between 2020 and 2025, consumer goods companies added layers of supply chain infrastructure in response to successive disruptions. Each decision was individually rational. Collectively, they produced architectures that are more expensive, slow to adapt, and hard to govern. This supply chain rationalization navigator provides the structured decision environment to identify where complexity erodes value, determine what to rationalize, sequence the changes, and prevent relapse.
Supply chains in the consumer goods industry have become the most structurally complex operating domain in the enterprise. Between 2020 and 2025, consumer goods companies added layers of redundancy, including near-shoring, dual-sourcing, inventory buffers, and digital monitoring tools, in response to cascading disruptions from pandemic-era demand volatility, retailer inventory whiplaxsh, commodity price shocks, and shifting channel economics.
The irony is sharp. Consumer goods enterprises invested heavily in resilience and ended up with complexity. They have more data about their supply chains than at any point in history, from point-of-sale (POS) feeds and retailer portals to IoT-enabled logistics, yet less clarity about what to do with it.
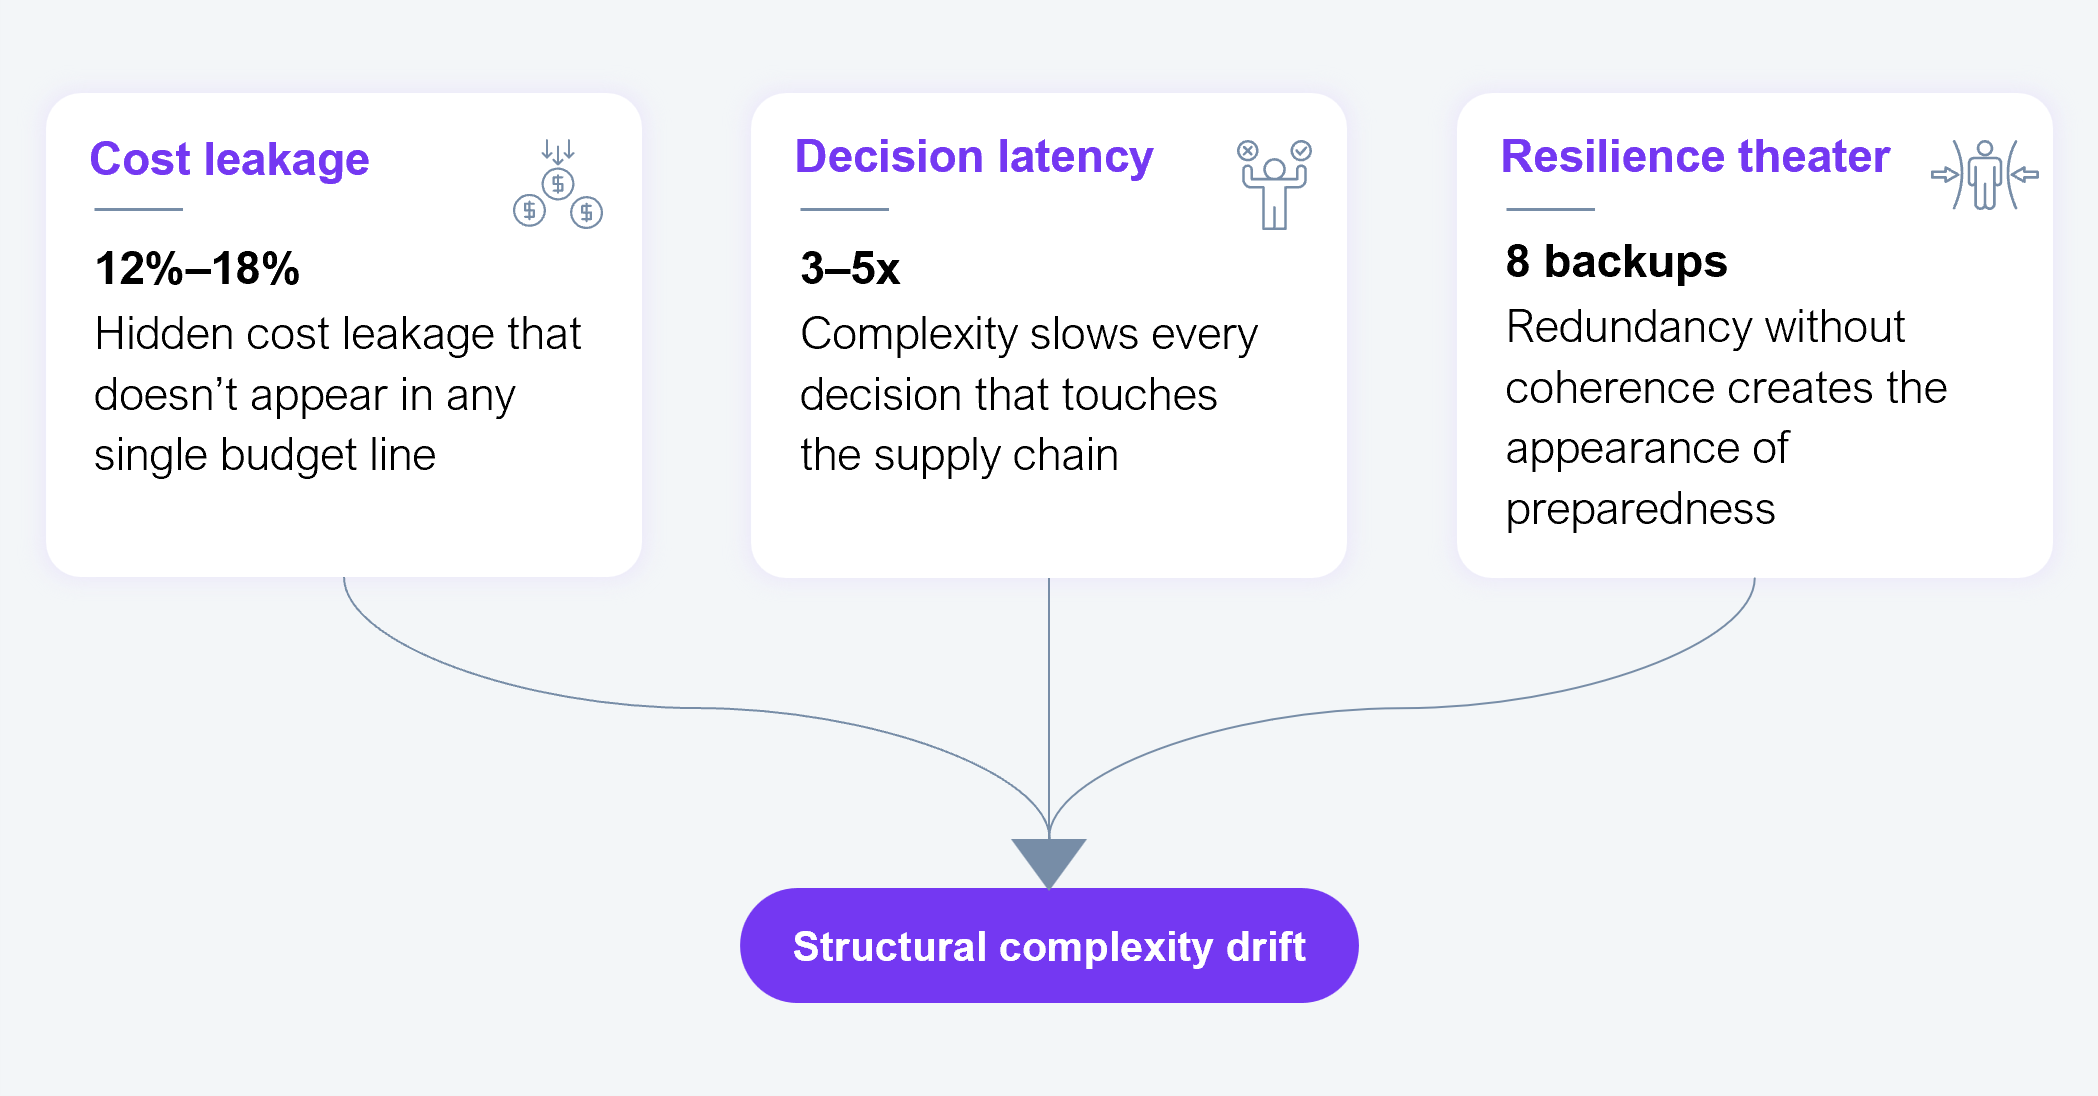
HFS labels this “structural complexity drift,” encompassing the gradual accumulation of redundant nodes, overlapping capabilities, and conflicting optimization targets. In consumer goods, this drift is compounded by stock-keeping unit (SKU) proliferation, promotional complexity, and the growing number of channels, from traditional retail and e-commerce to direct-to-consumer and quick commerce, each demanding distinct fulfillment architectures.
Source: HFS Research, 2026
Cost leakage hides in the architecture itself. HFS estimates 12%–18% in hidden costs do not appear in any single budget line. In consumer goods, this often manifests as inflated cost-to-serve for long-tail SKUs, redundant warehousing for promotional inventory, and carrier fragmentation across e-commerce and retail fulfillment. Resilience theater creates the appearance of preparedness without underlying coherence: a consumer goods company with eight backup co-packers and five demand-sensing platforms is not resilient if it cannot activate the right response when a key retailer changes order patterns. Decision latency slows every choice that touches the supply chain.
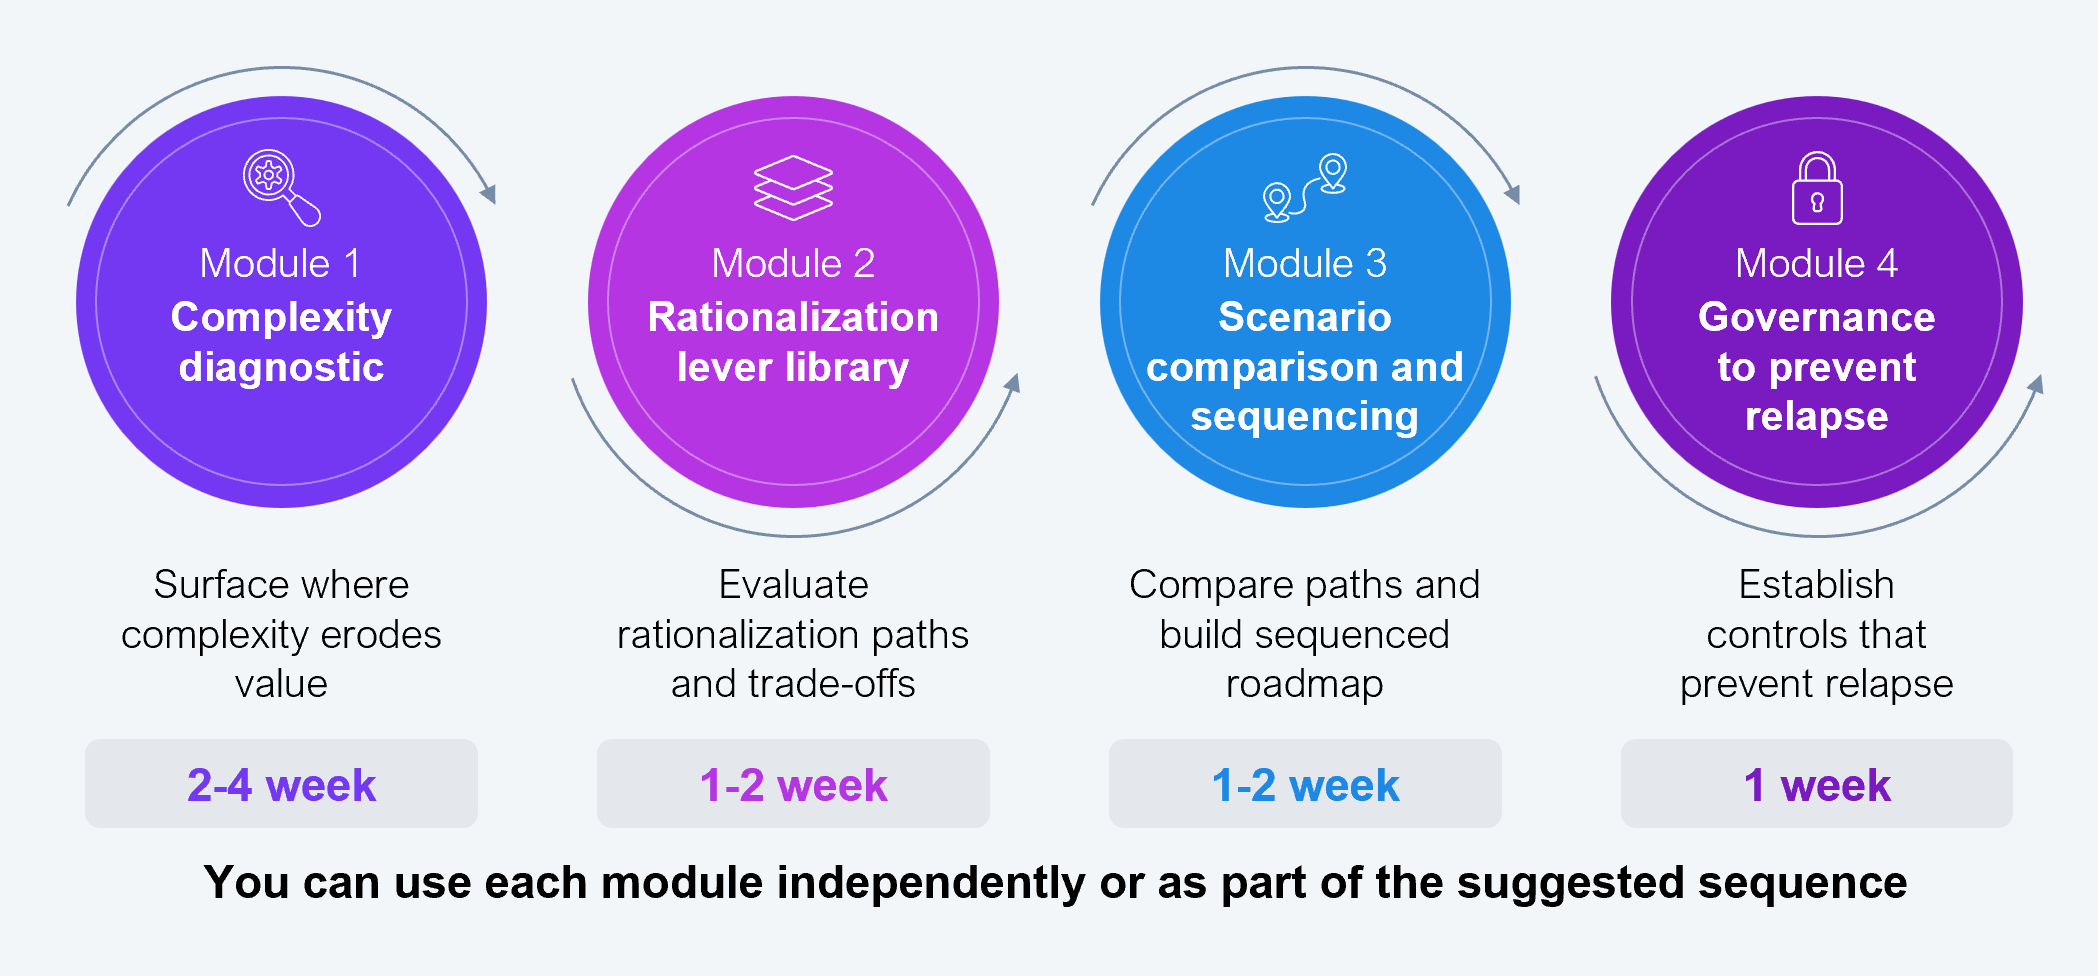
The HFS Supply Chain Rationalization Navigator is an executive decision environment designed to help consumer goods leaders surface where complexity erodes value, evaluate rationalization paths, build a sequenced roadmap, and establish governance to prevent relapse.
Source: HFS Research, 2026
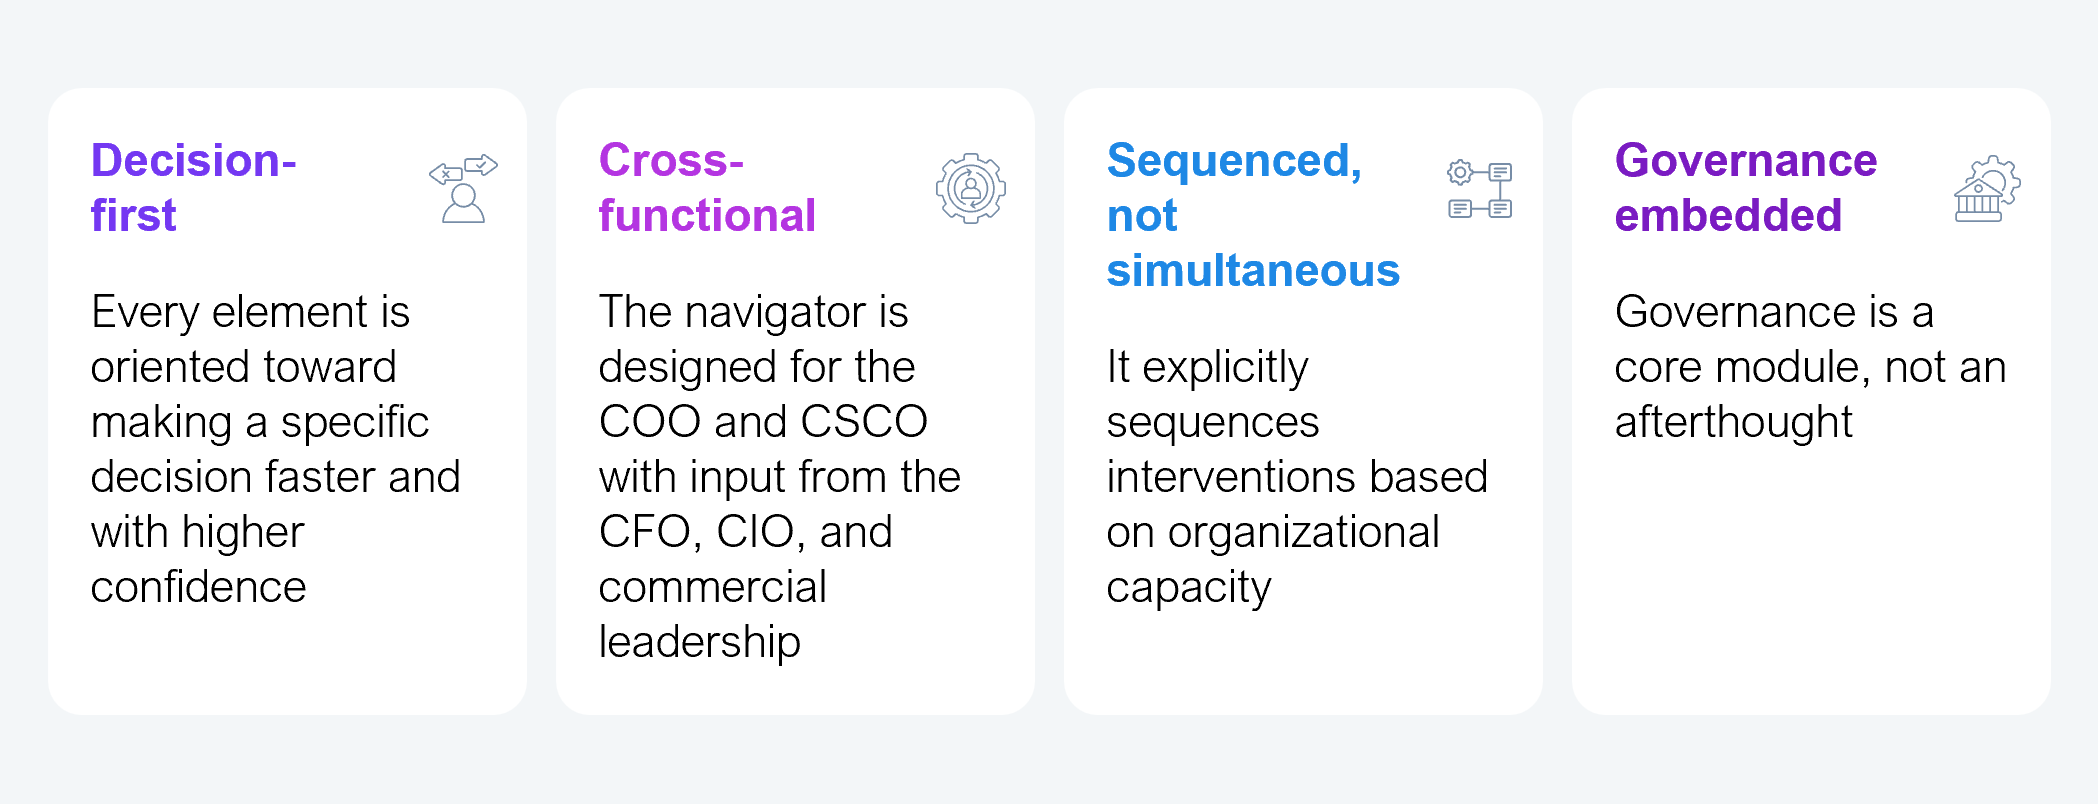
The navigator was designed around four principles derived from HFS’s ongoing engagement with supply chain leaders across consumer goods companies, from global fast-moving consumer goods (FMCG) multinationals to mid-market branded goods companies navigating the same structural complexity at different scales.
Source: HFS Research, 2026
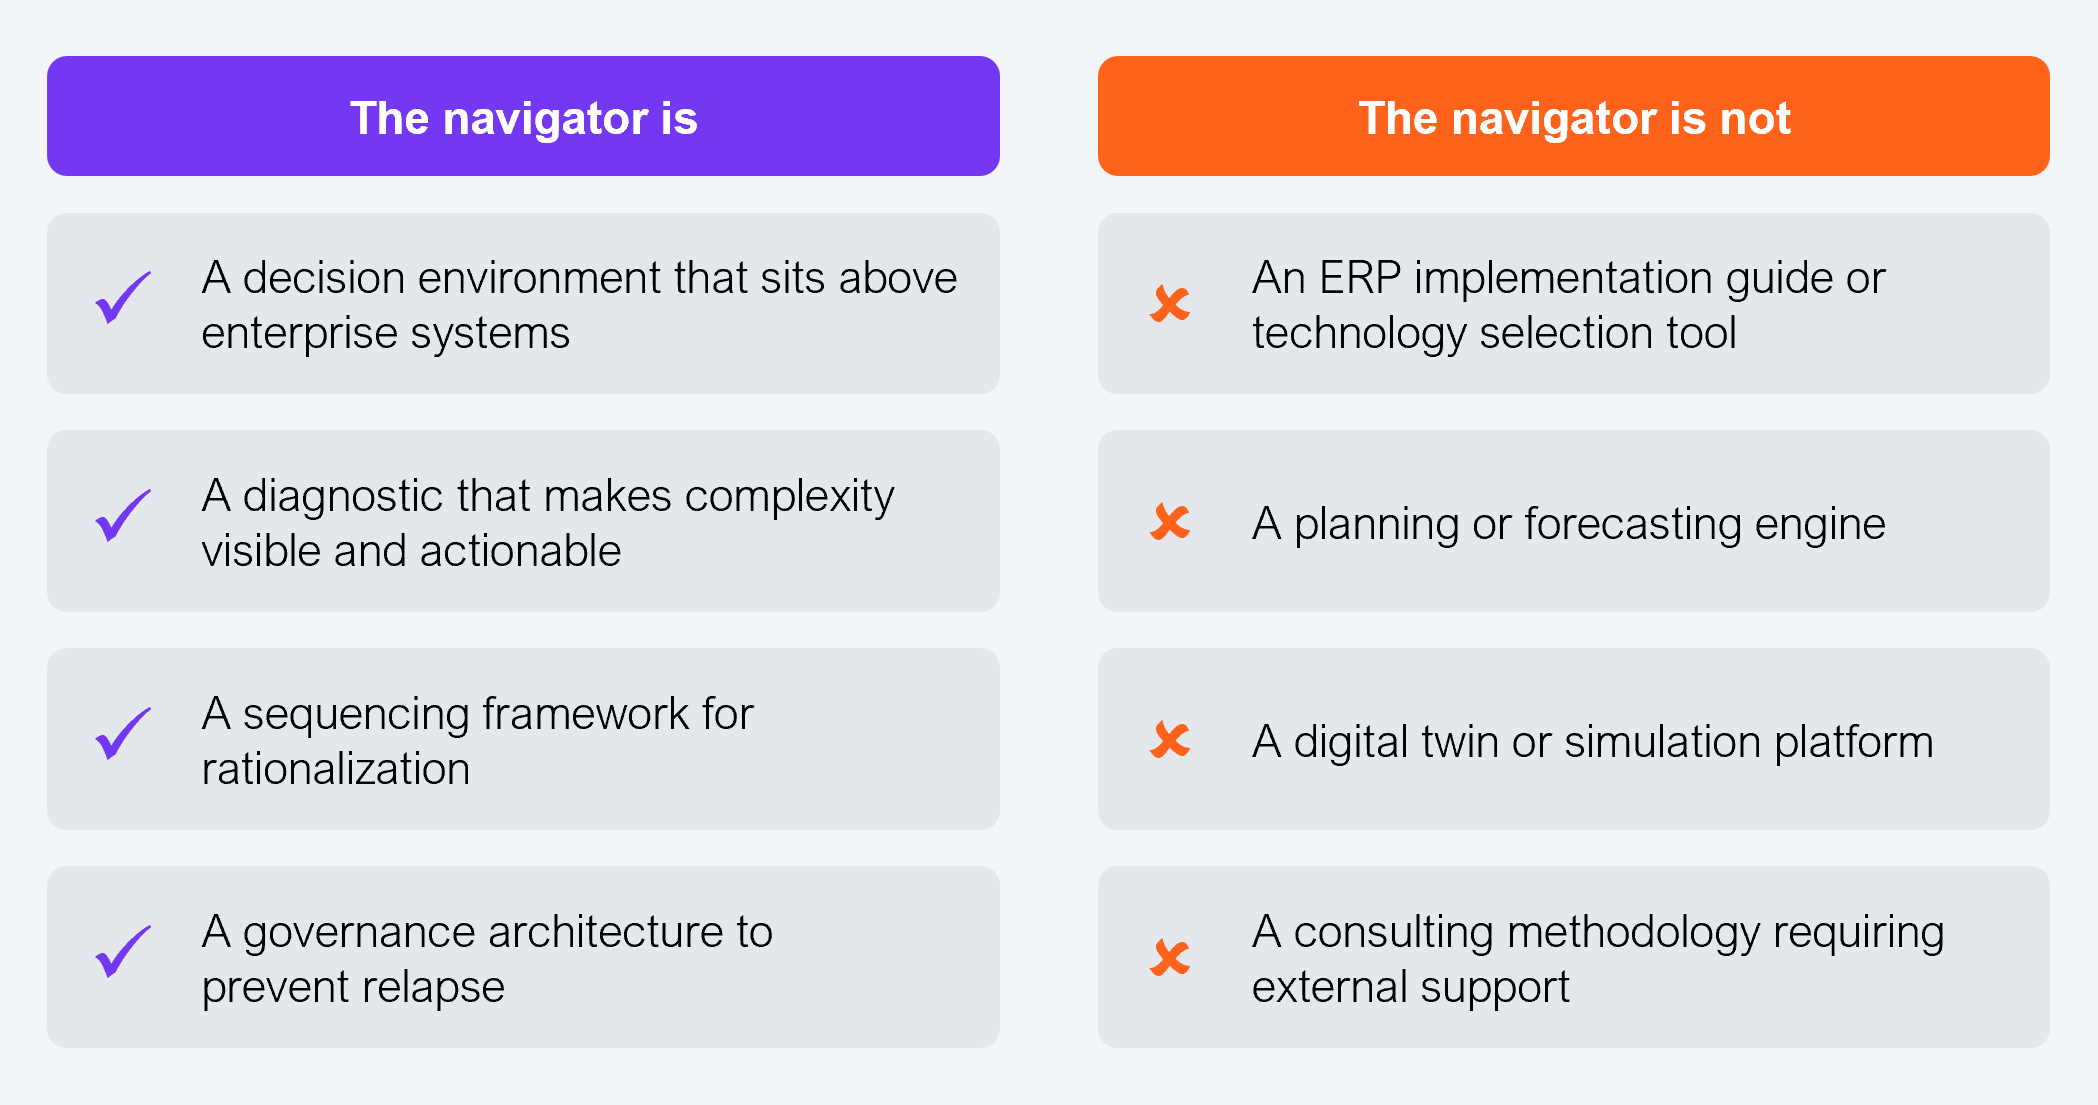
Positioning matters. Consumer goods supply chain leaders have been pitched dozens of transformation frameworks and technology solutions. The navigator is none of those things. It is a decision environment: a diagnostic and planning tool that helps leadership teams make better rationalization decisions, not a system replacement or implementation methodology.
Source: HFS Research, 2026
Procedure
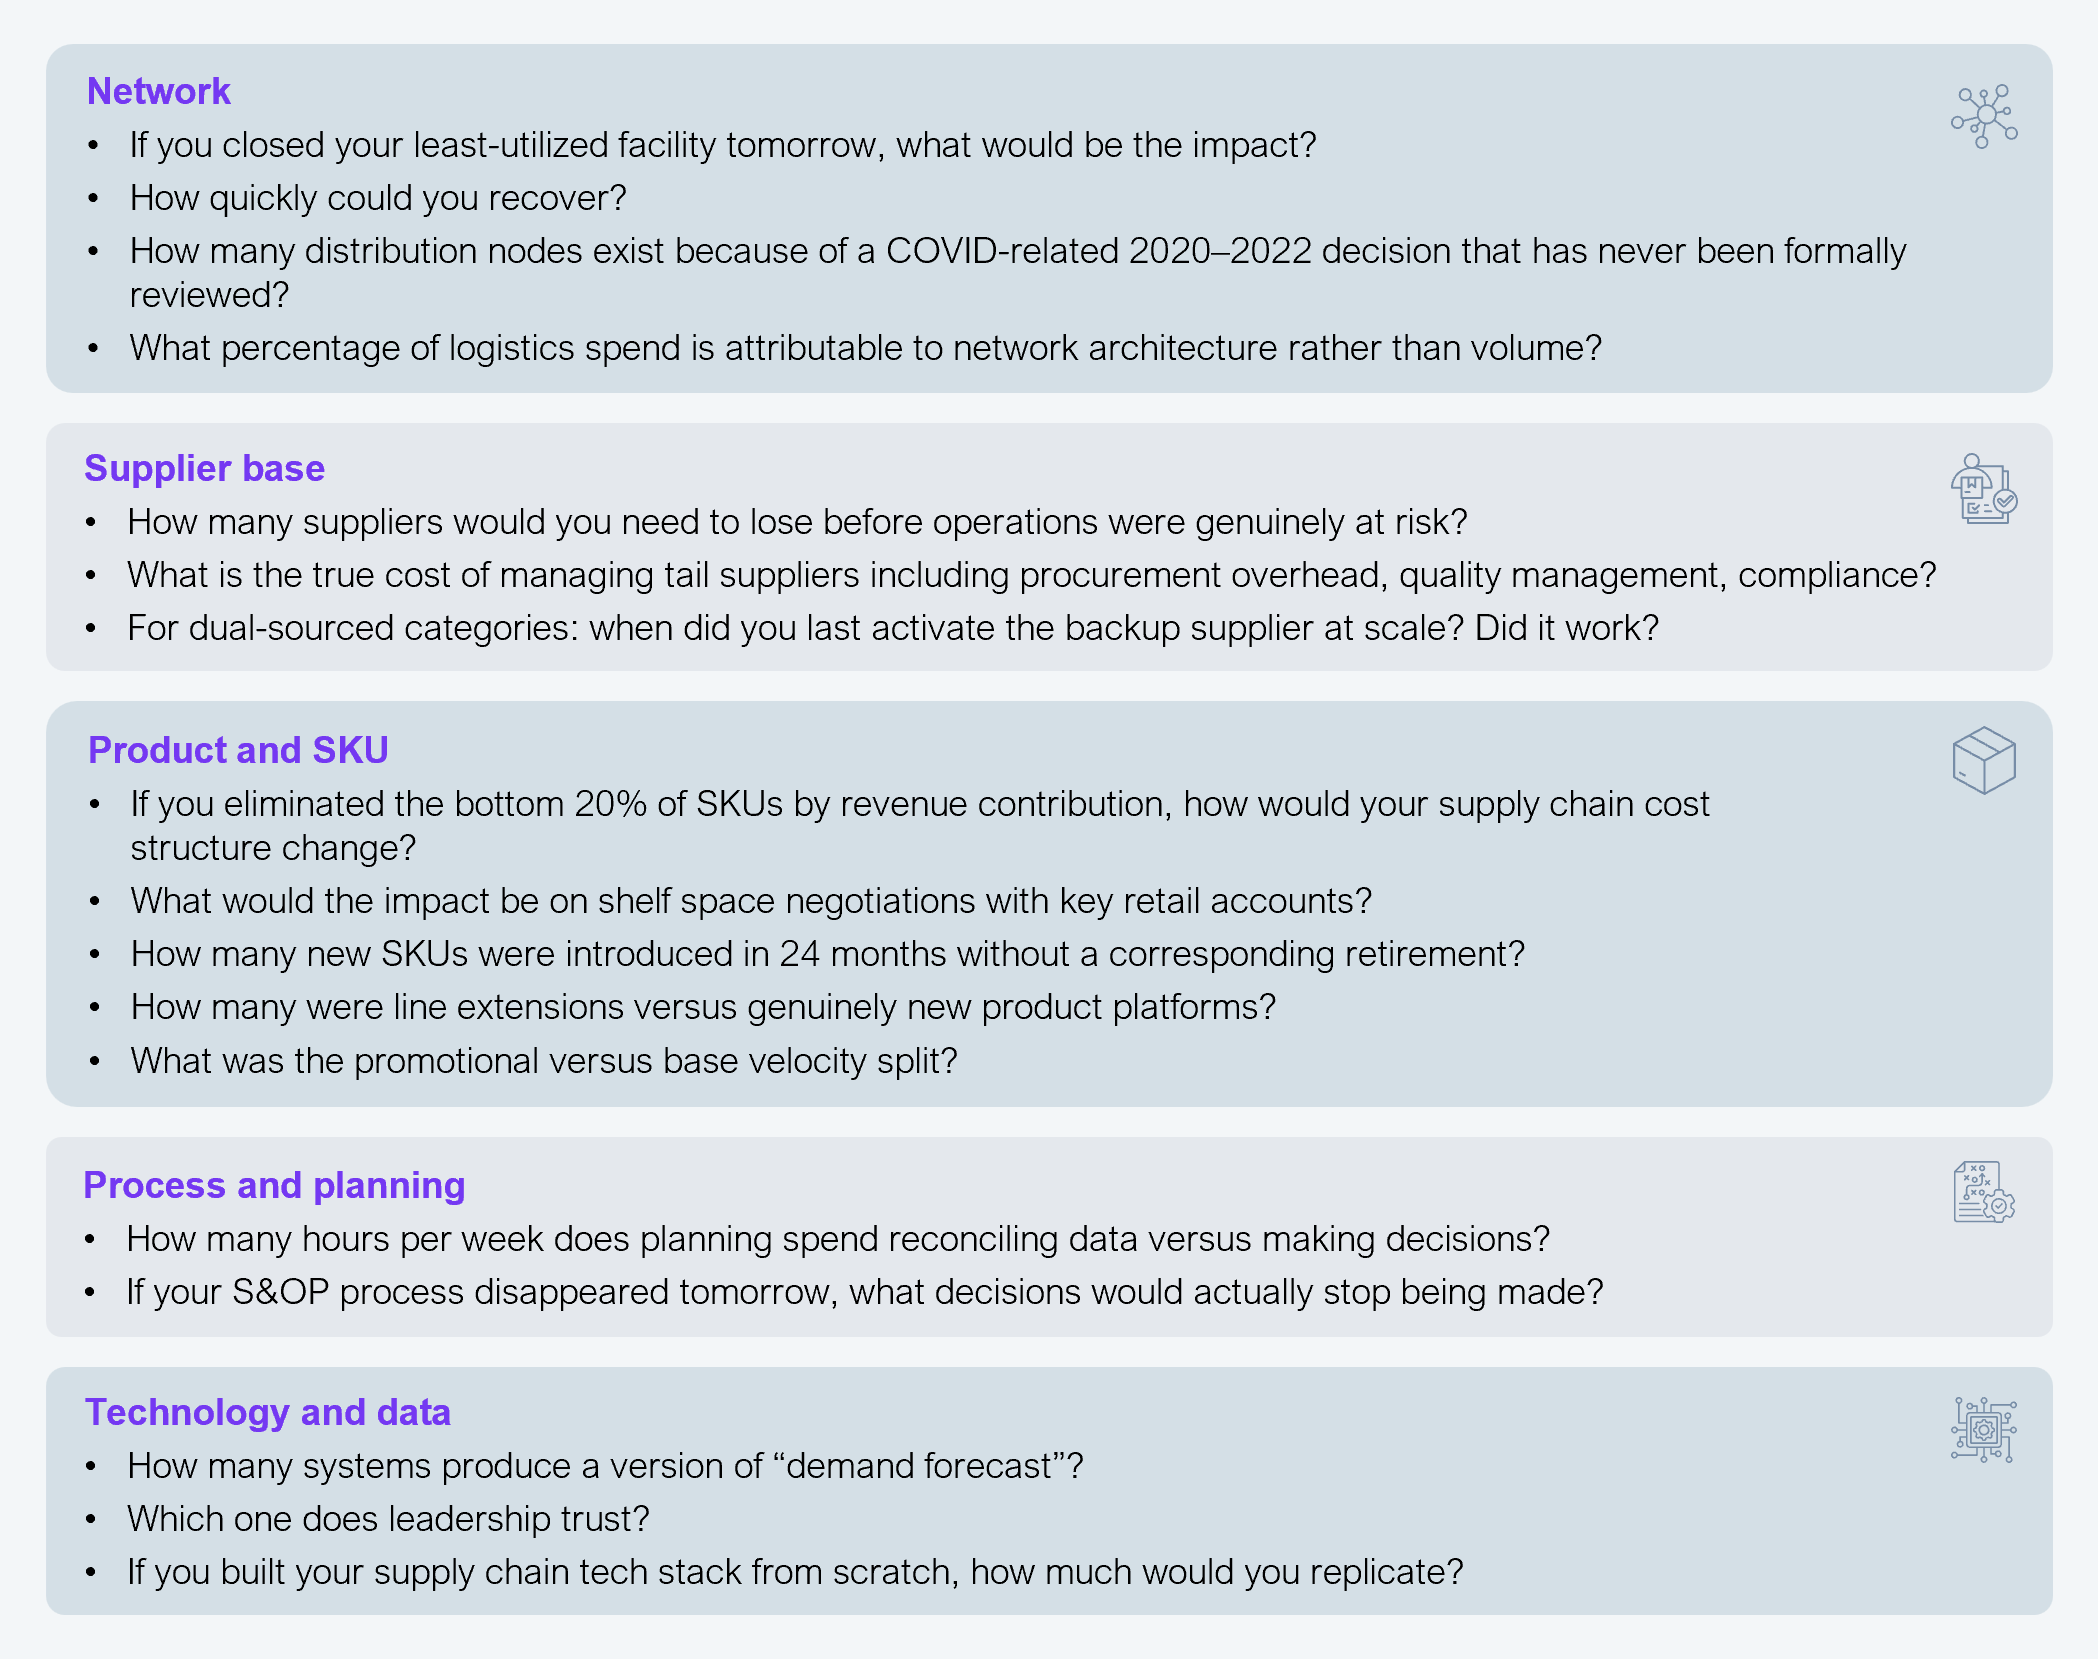
1.1 Answer the diagnostic questions for each domain
These questions are designed for cross-functional leadership teams in a structured workshop setting. They are deliberately provocative and are meant to surface uncomfortable truths, not confirm existing assumptions.
Supply chain complexity in consumer goods concentrates in five domains, each with distinct causes, symptoms, and cost profiles. The Product/SKU domain tends to be disproportionately overloaded in this industry due to the compounding effects of portfolio proliferation, promotional intensity, and retailer-driven assortment requirements.
Answer these diagnostic questions for each domain, using as much evidence as you can surface from your organization. Record your answers for each. You won’t score them individually; rather, they surface evidence to inform the next step, the complexity heat map scores.
Source: HFS Research, 2026
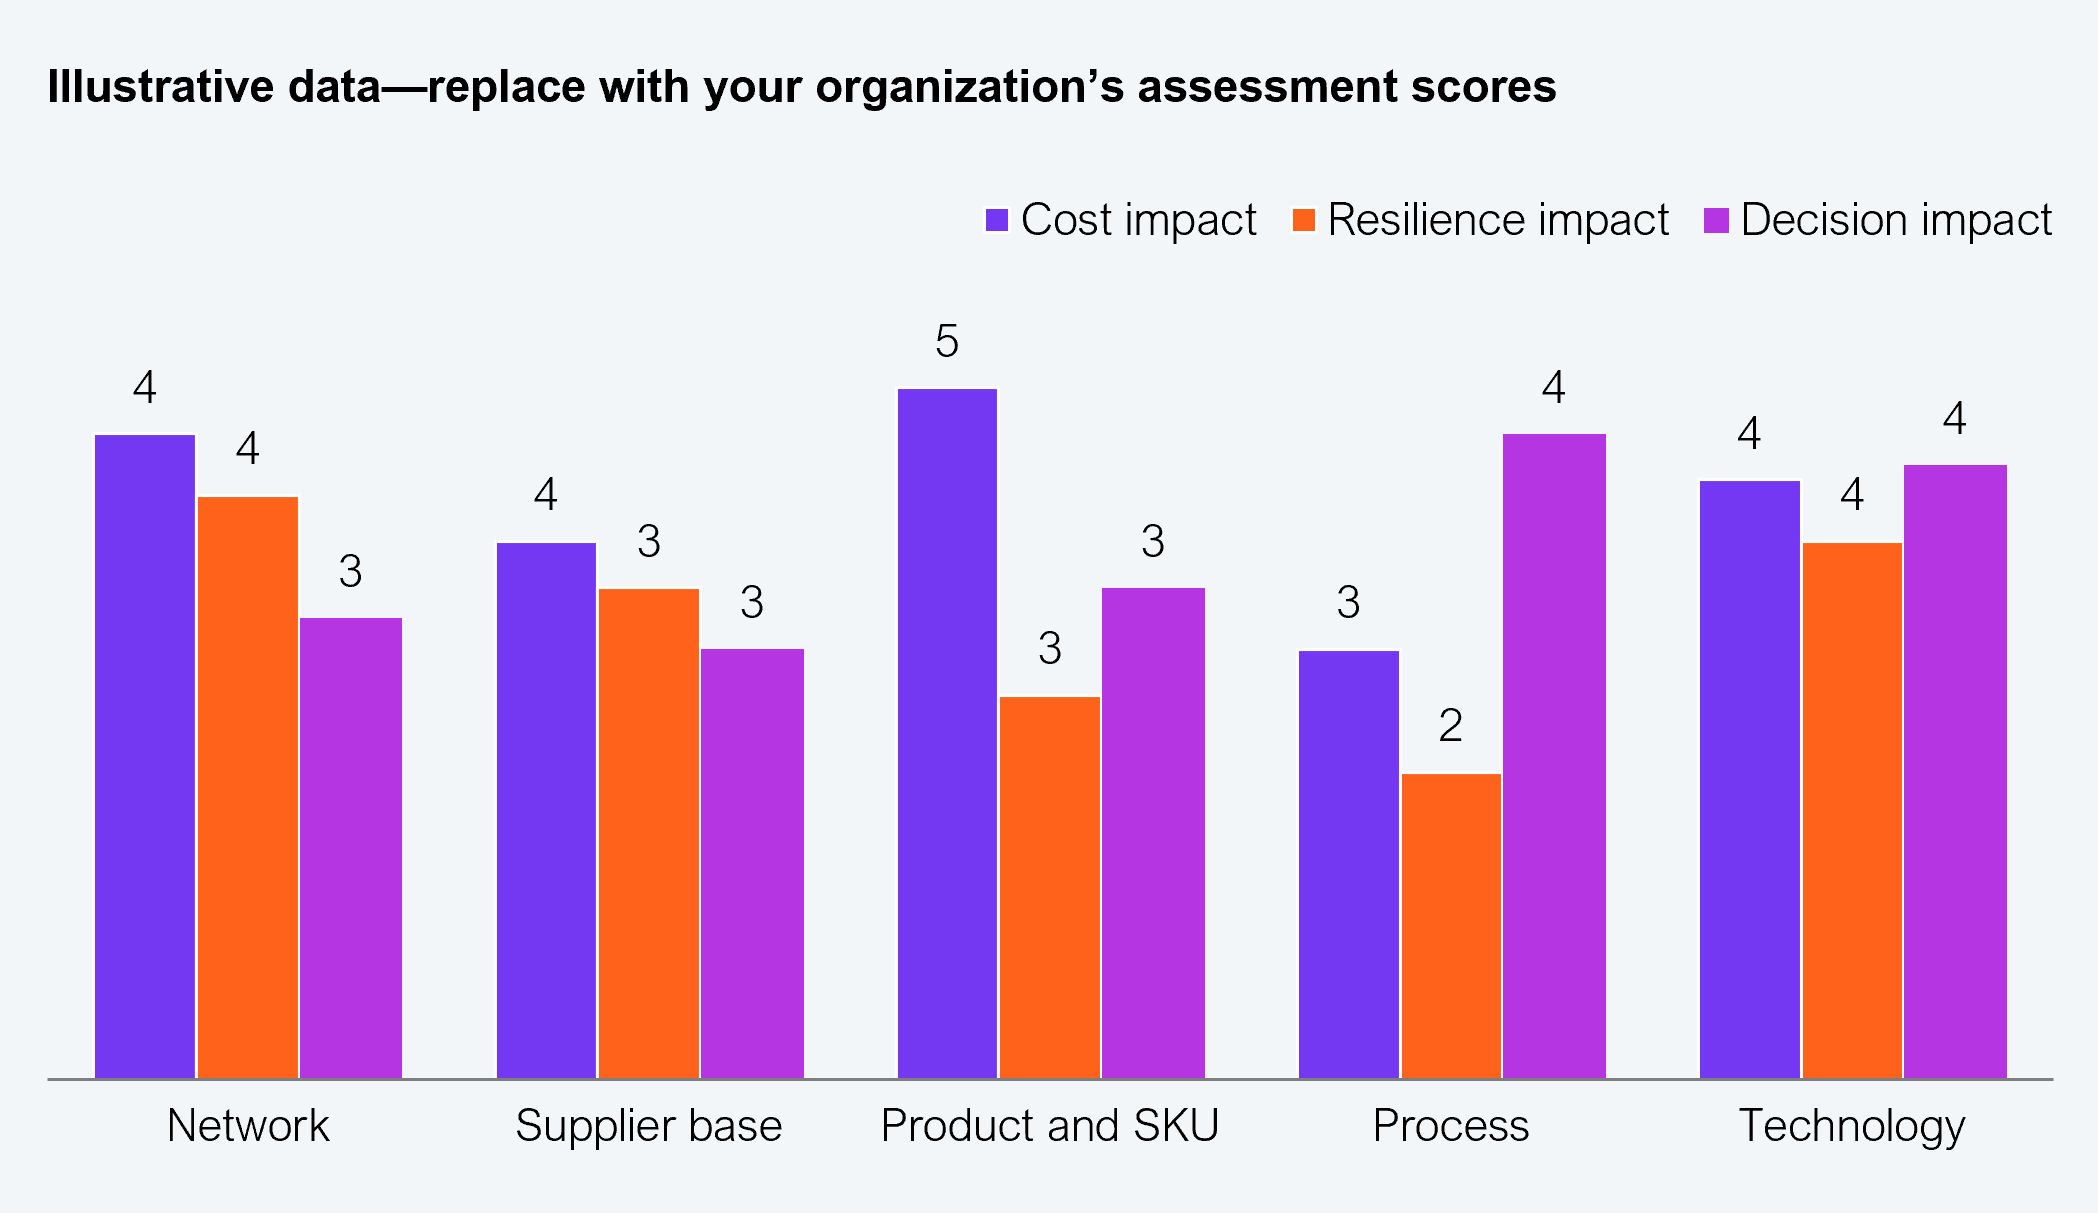
1.2 Create a complexity heat map
Further assess each element along three impact dimensions (cost, resilience, decision) to create a complexity heat map.
For each domain, score your current state on a 1–5 scale across three dimensions of impact, cost impact, resilience impact, and decision impact, and chart them as shown in Exhibit 6 so you can quickly see relative impact. The domains with the highest aggregate scores represent the greatest rationalization opportunity.
The example heatmap in Exhibit 6 shows what a completed scoring exercise would look like. Replace all values with your leadership team’s actual assessments.
Source: HFS Research, 2026
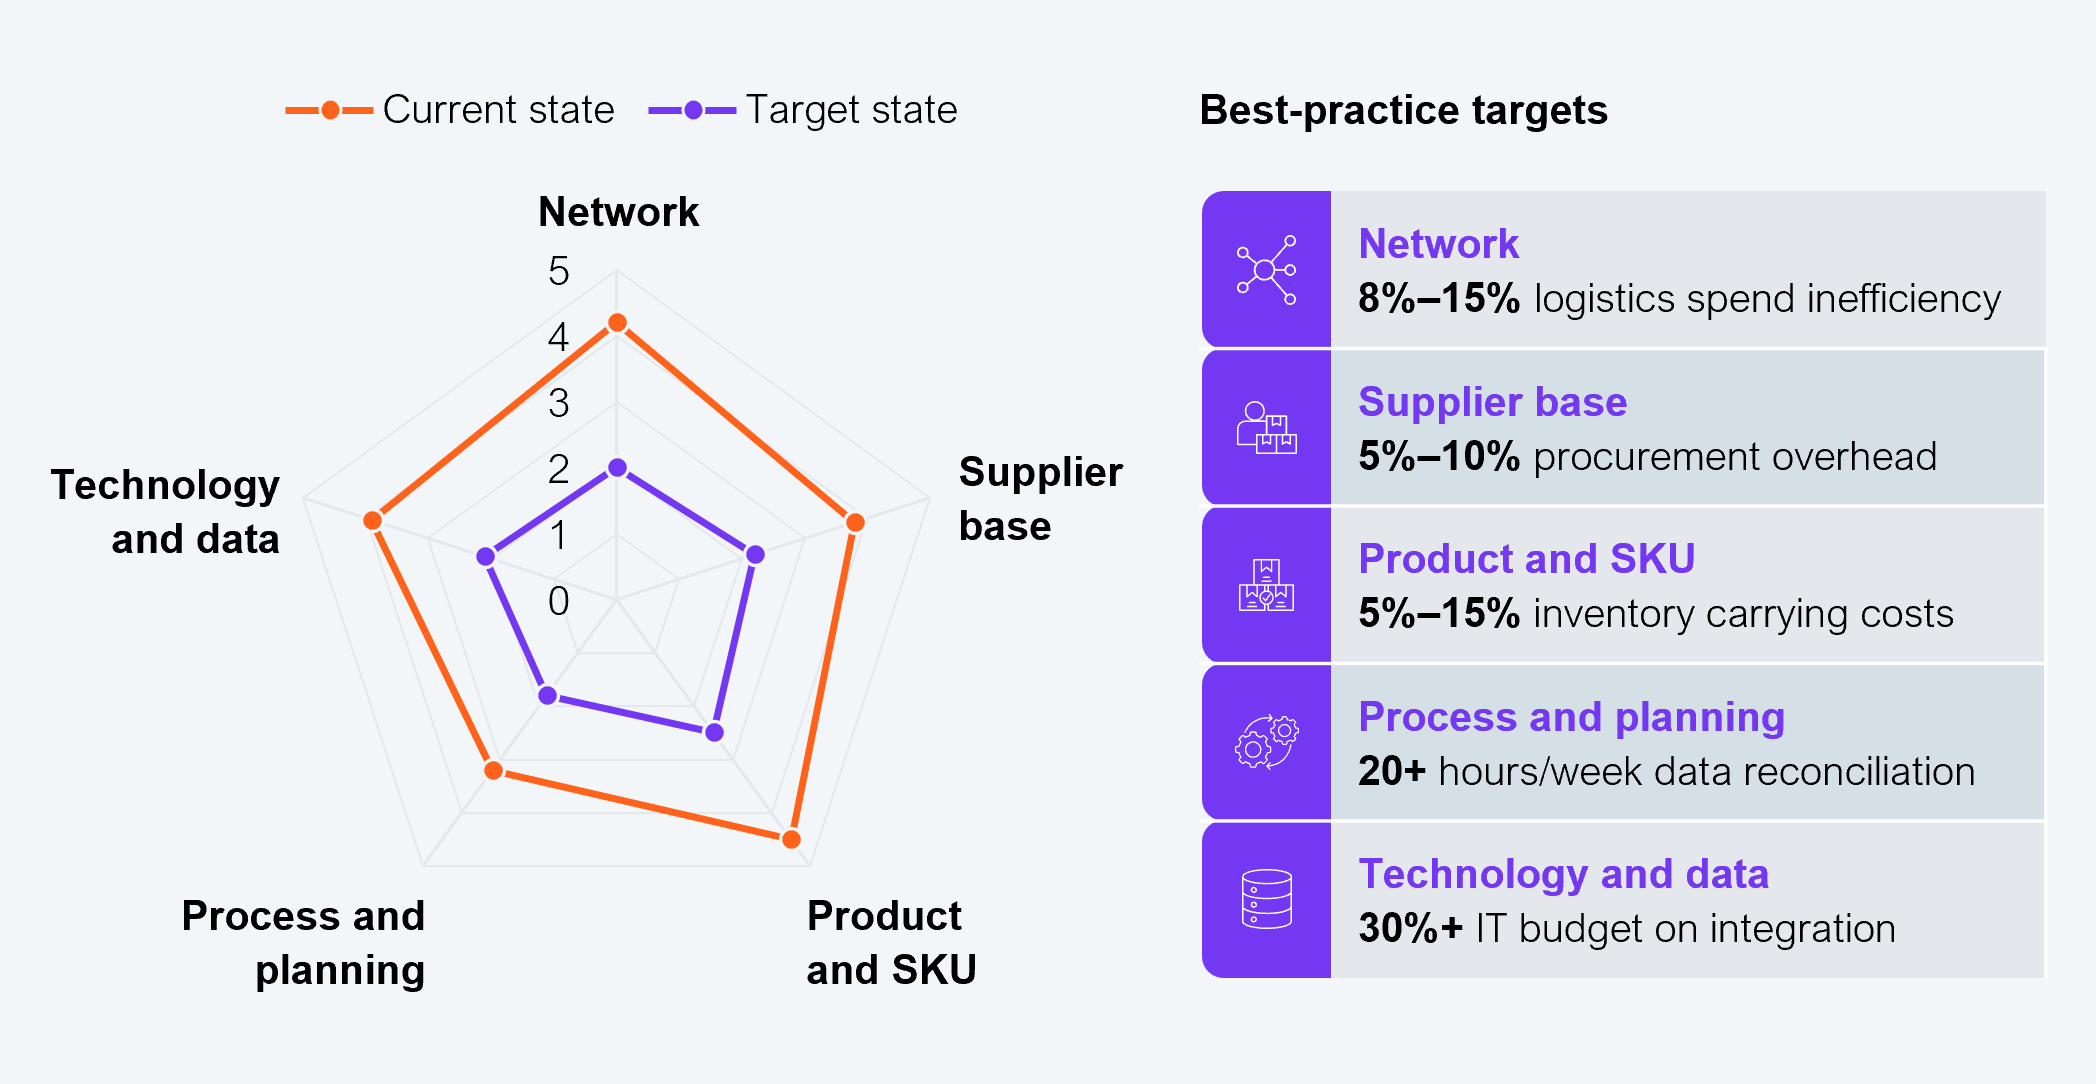
1.3 Score and prioritize the five complexity domains
Using the heat map you created, the evidence from step 1, and your judgment and experience, give each domain an overall complexity score (0–5) and add it to the radar chart, as shown in Exhibit 7. This sample radar chart represents what a completed domain assessment would look like for a hypothetical mid-market consumer goods company.
Replace the orange line with your organization’s actual scores. The relative complexity of each of these domains in their best-practice state is shown by the purple line on the chart; leave that in place when comparing the complexity ratings you create. The list of domains on the right includes best-practice targets for each domain. Select up to three domains you would like to focus on to reduce complexity to near the ideal state. These are the results of this module and the input for the next module.
Source: HFS Research, 2026
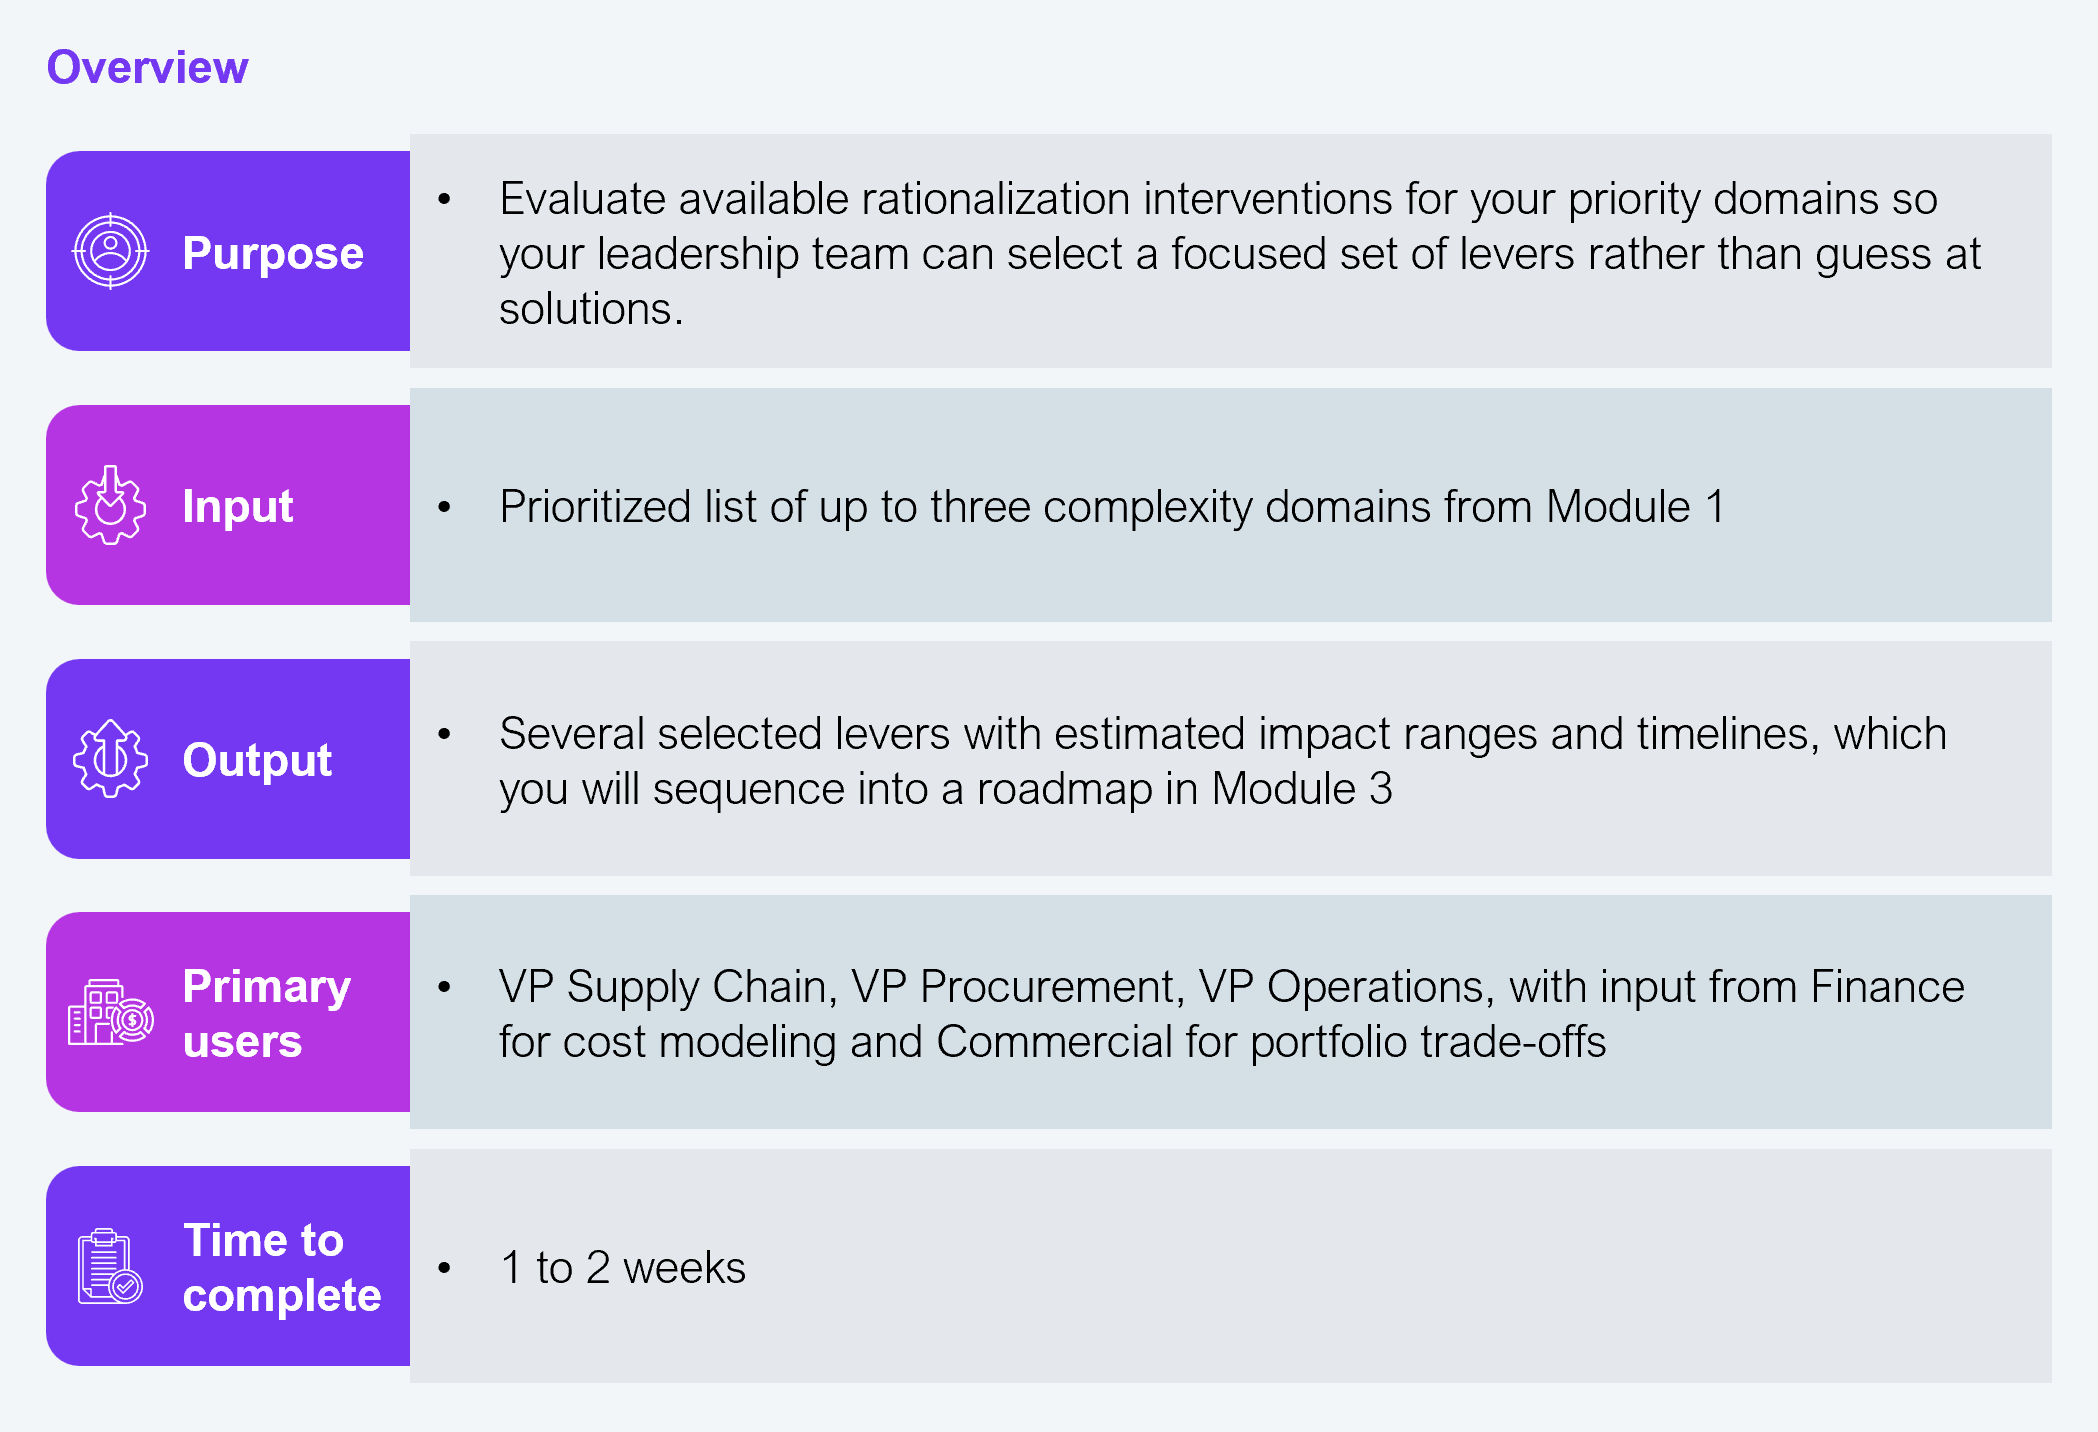
Procedure
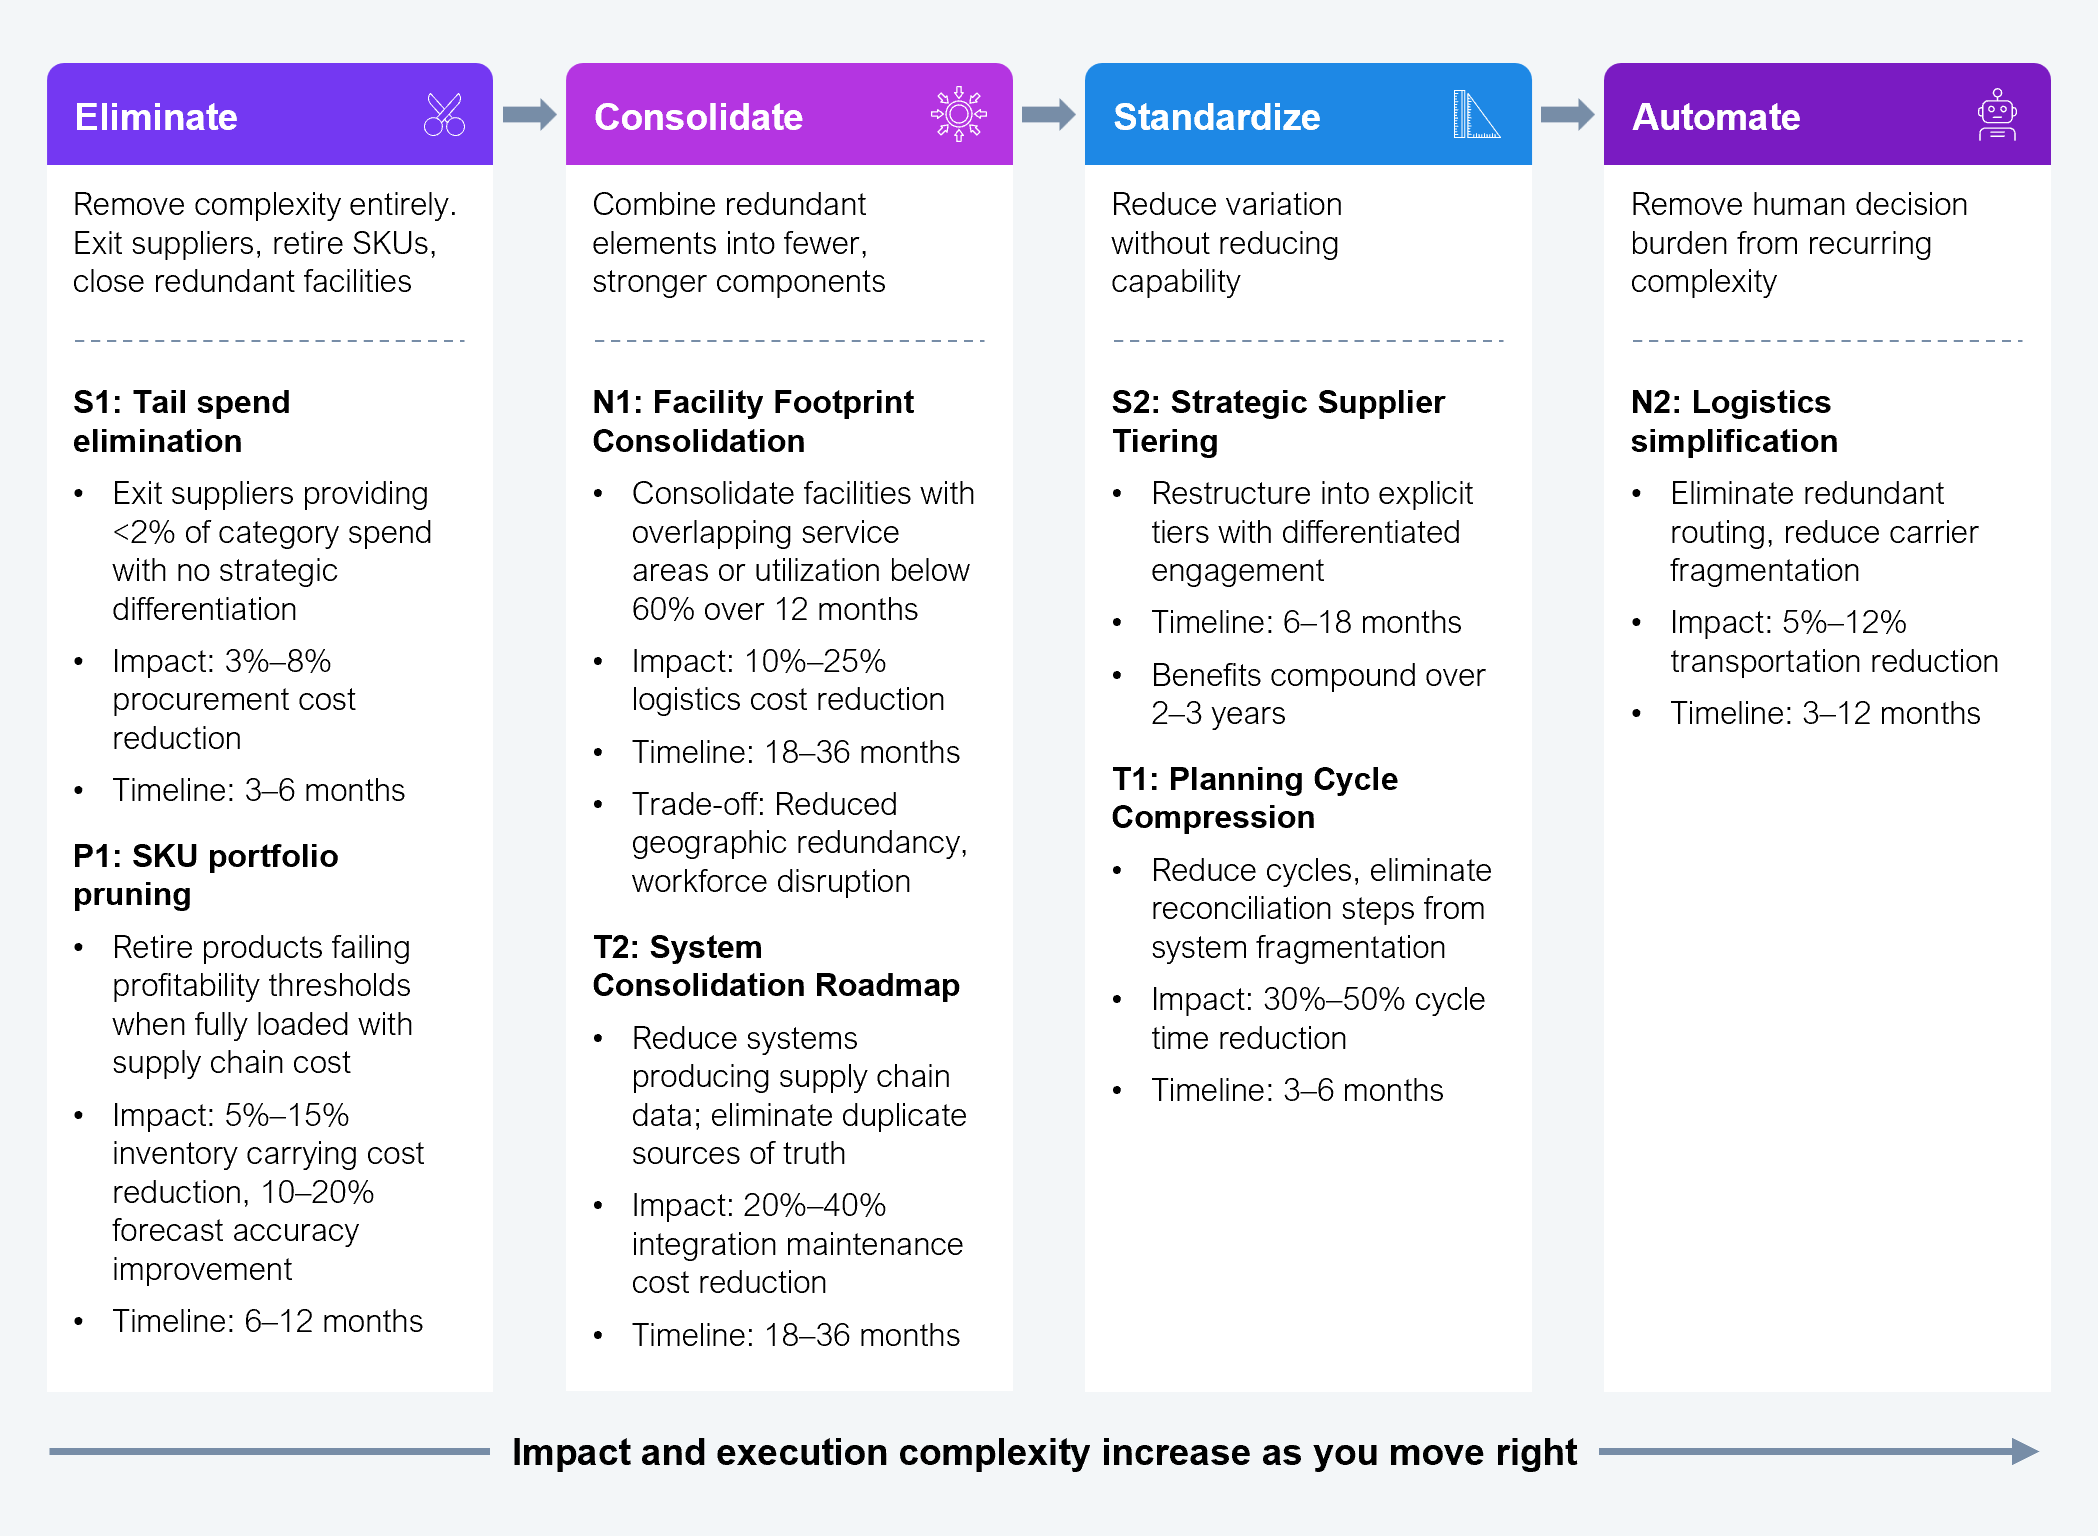
2.1 Review the four intervention types and seven levers
Reference Exhibit 8 to review the four intervention types (Eliminate, Consolidate, Standardize, Automate) and the levers associated with each. Each lever is coded to a complexity domain: N = Network, S = Supplier, P = Product/SKU, T = Process/Planning and Technology/Data. These codes are used in Exhibit 9, which maps levers along axes measuring time to value and cost reduction.
Consumer goods companies should pay particular attention to the Eliminate and Consolidate categories, as the industry’s structural tendency toward SKU proliferation and supplier accumulation means the highest-ROI moves are often subtractive. For consumer goods, the SKU portfolio pruning lever carries the widest gap between knowing it is needed and executing it. Commercial teams resist retiring SKUs because of retailer shelf commitments, promotional calendars, and the sunk cost of trade spend. Regarding the Consolidate category, planning complexity is amplified by promotional forecasting, retailer-specific demand signals, and the gap between integrated business planning and sales and operations execution.
Source: HFS Research, 2026
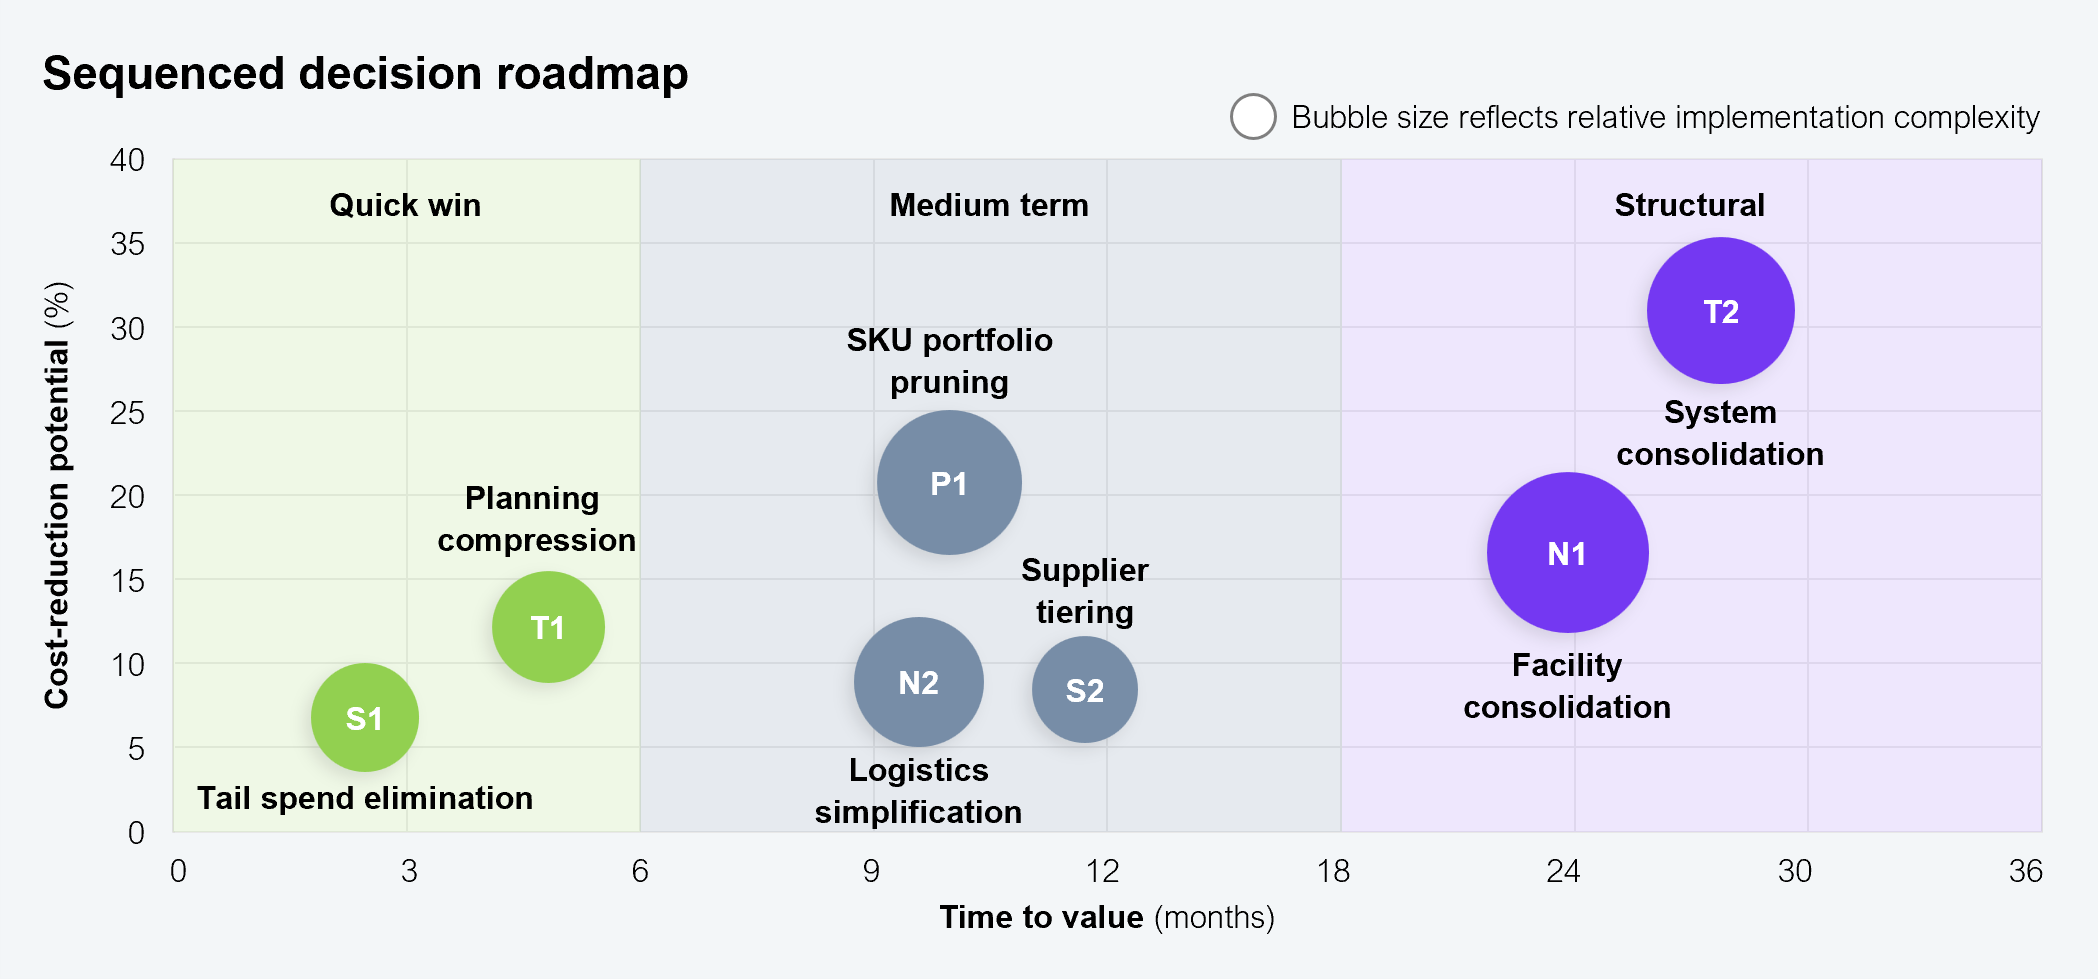
2.2 Evaluate the seven levers against your priority domains from Module 1, and map the trade-offs for each relevant lever
Focus only on levers that address your priority domains; for example, a lever targeting a non-priority domain is a distraction, regardless of its potential impact. The bubble chart in Exhibit 9 provides starting points; adjust the bubble sizes and positions based on your organization’s context and Module 1 diagnostic results.
The scatter plot maps each lever by its cost-reduction potential (vertical axis) and time to value (horizontal axis).
Source: HFS Research, 2026
2.3 Select your levers
Select three to four levers for your initial roadmap, based on three criteria:
The output for Module 2 is the list of levers you select. Most organizations should select no more than three or four levers for the initial roadmap. In Module 3, you’ll sequence these levers into a decision roadmap.
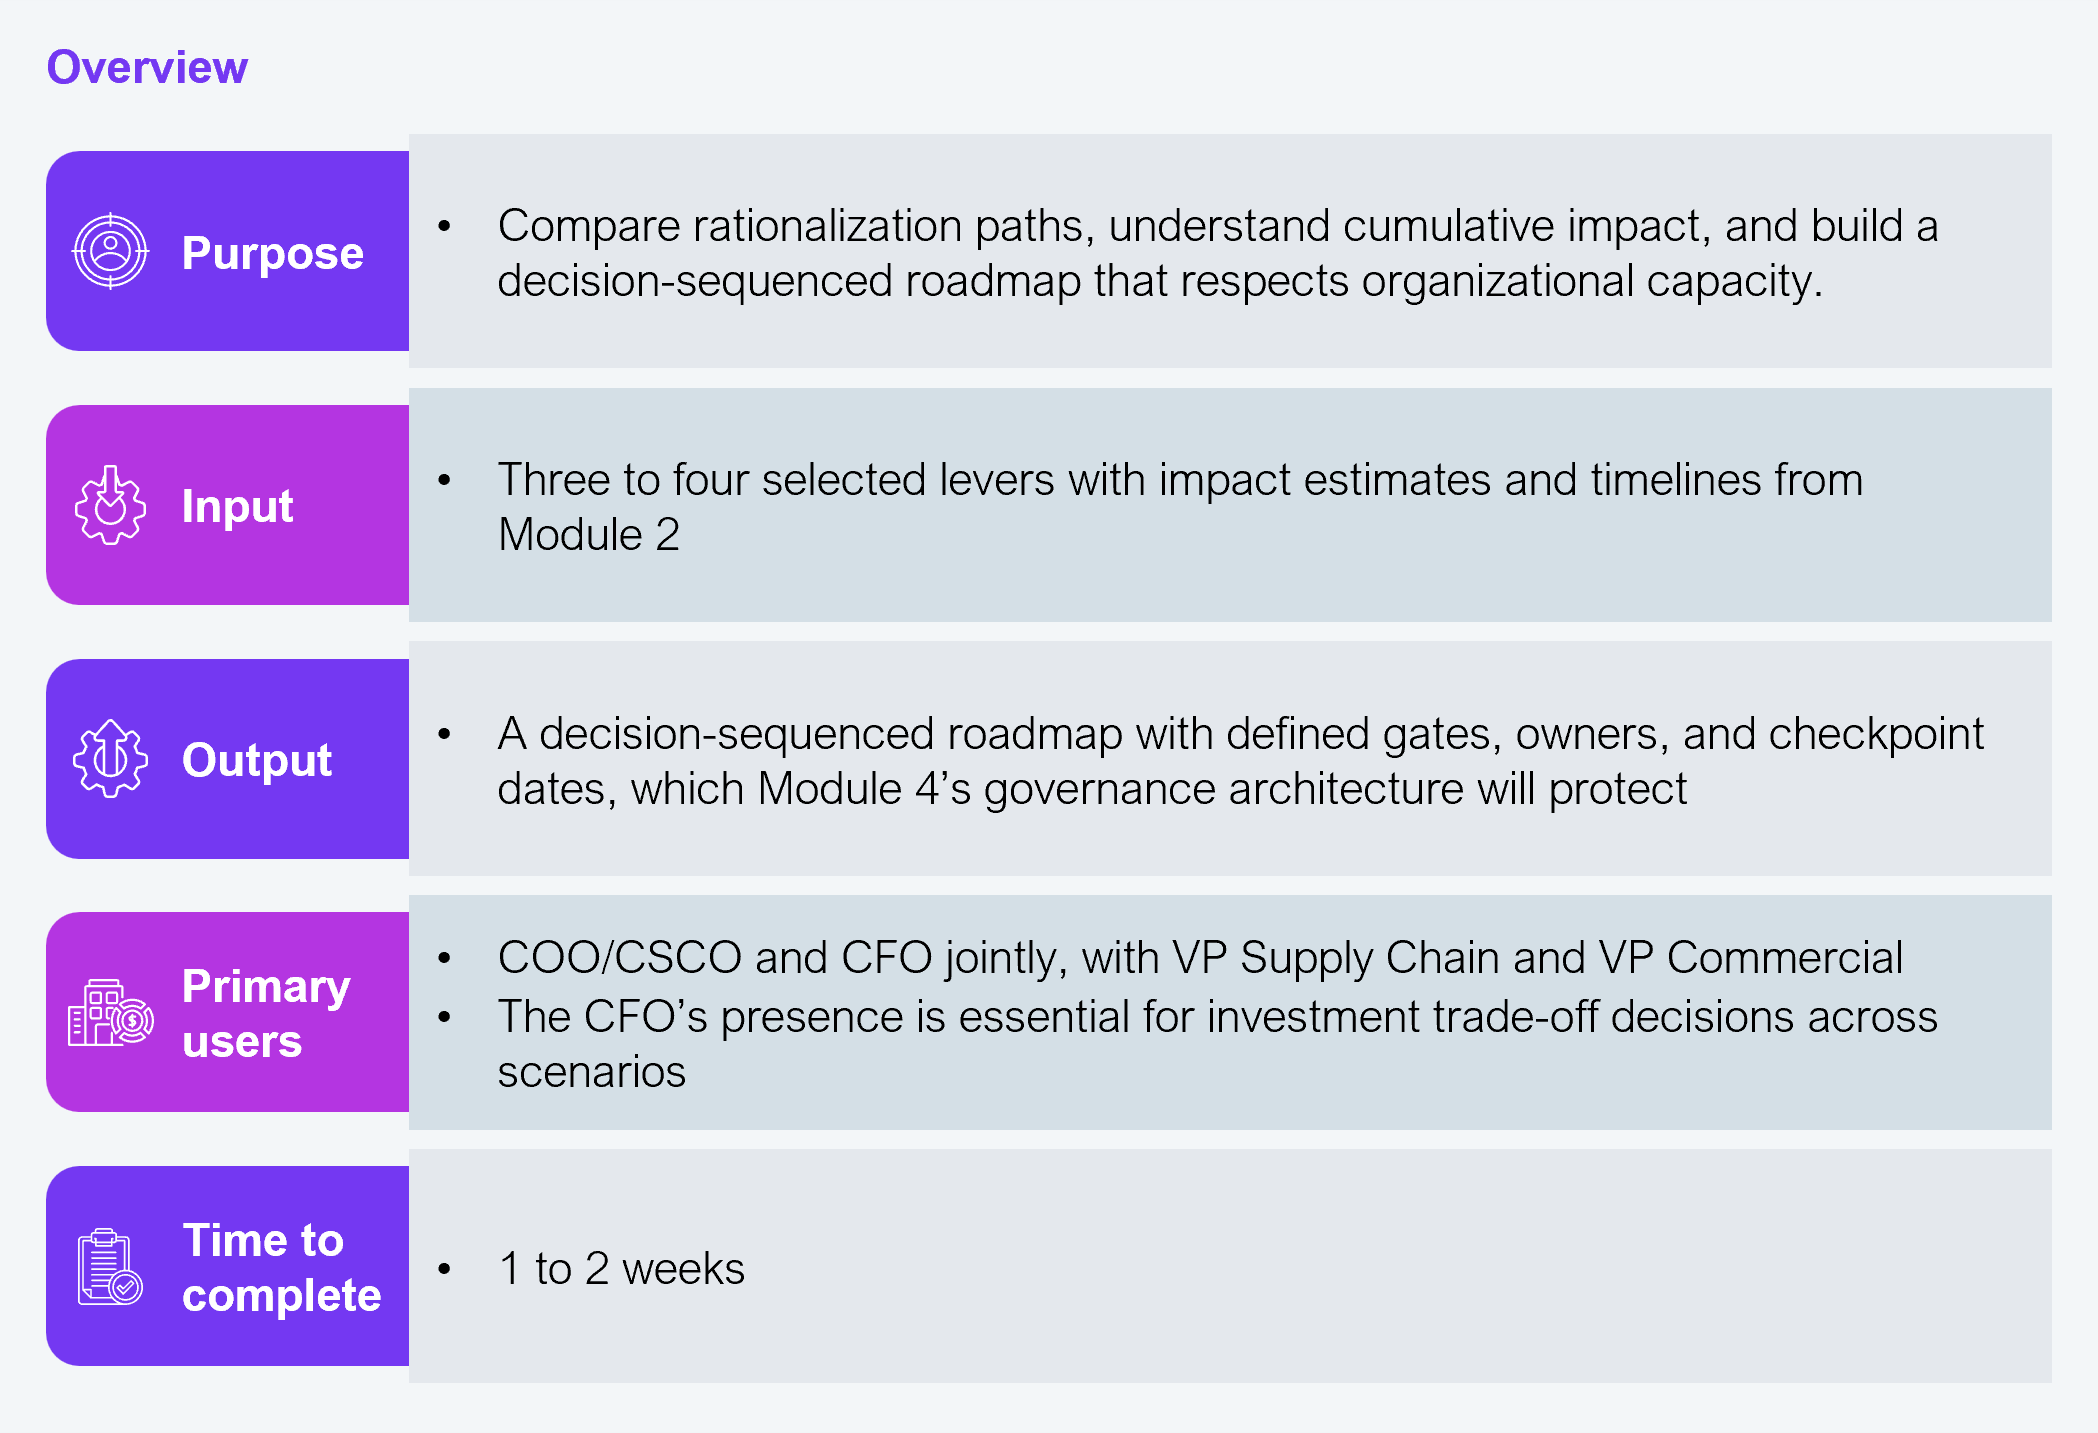
Procedure
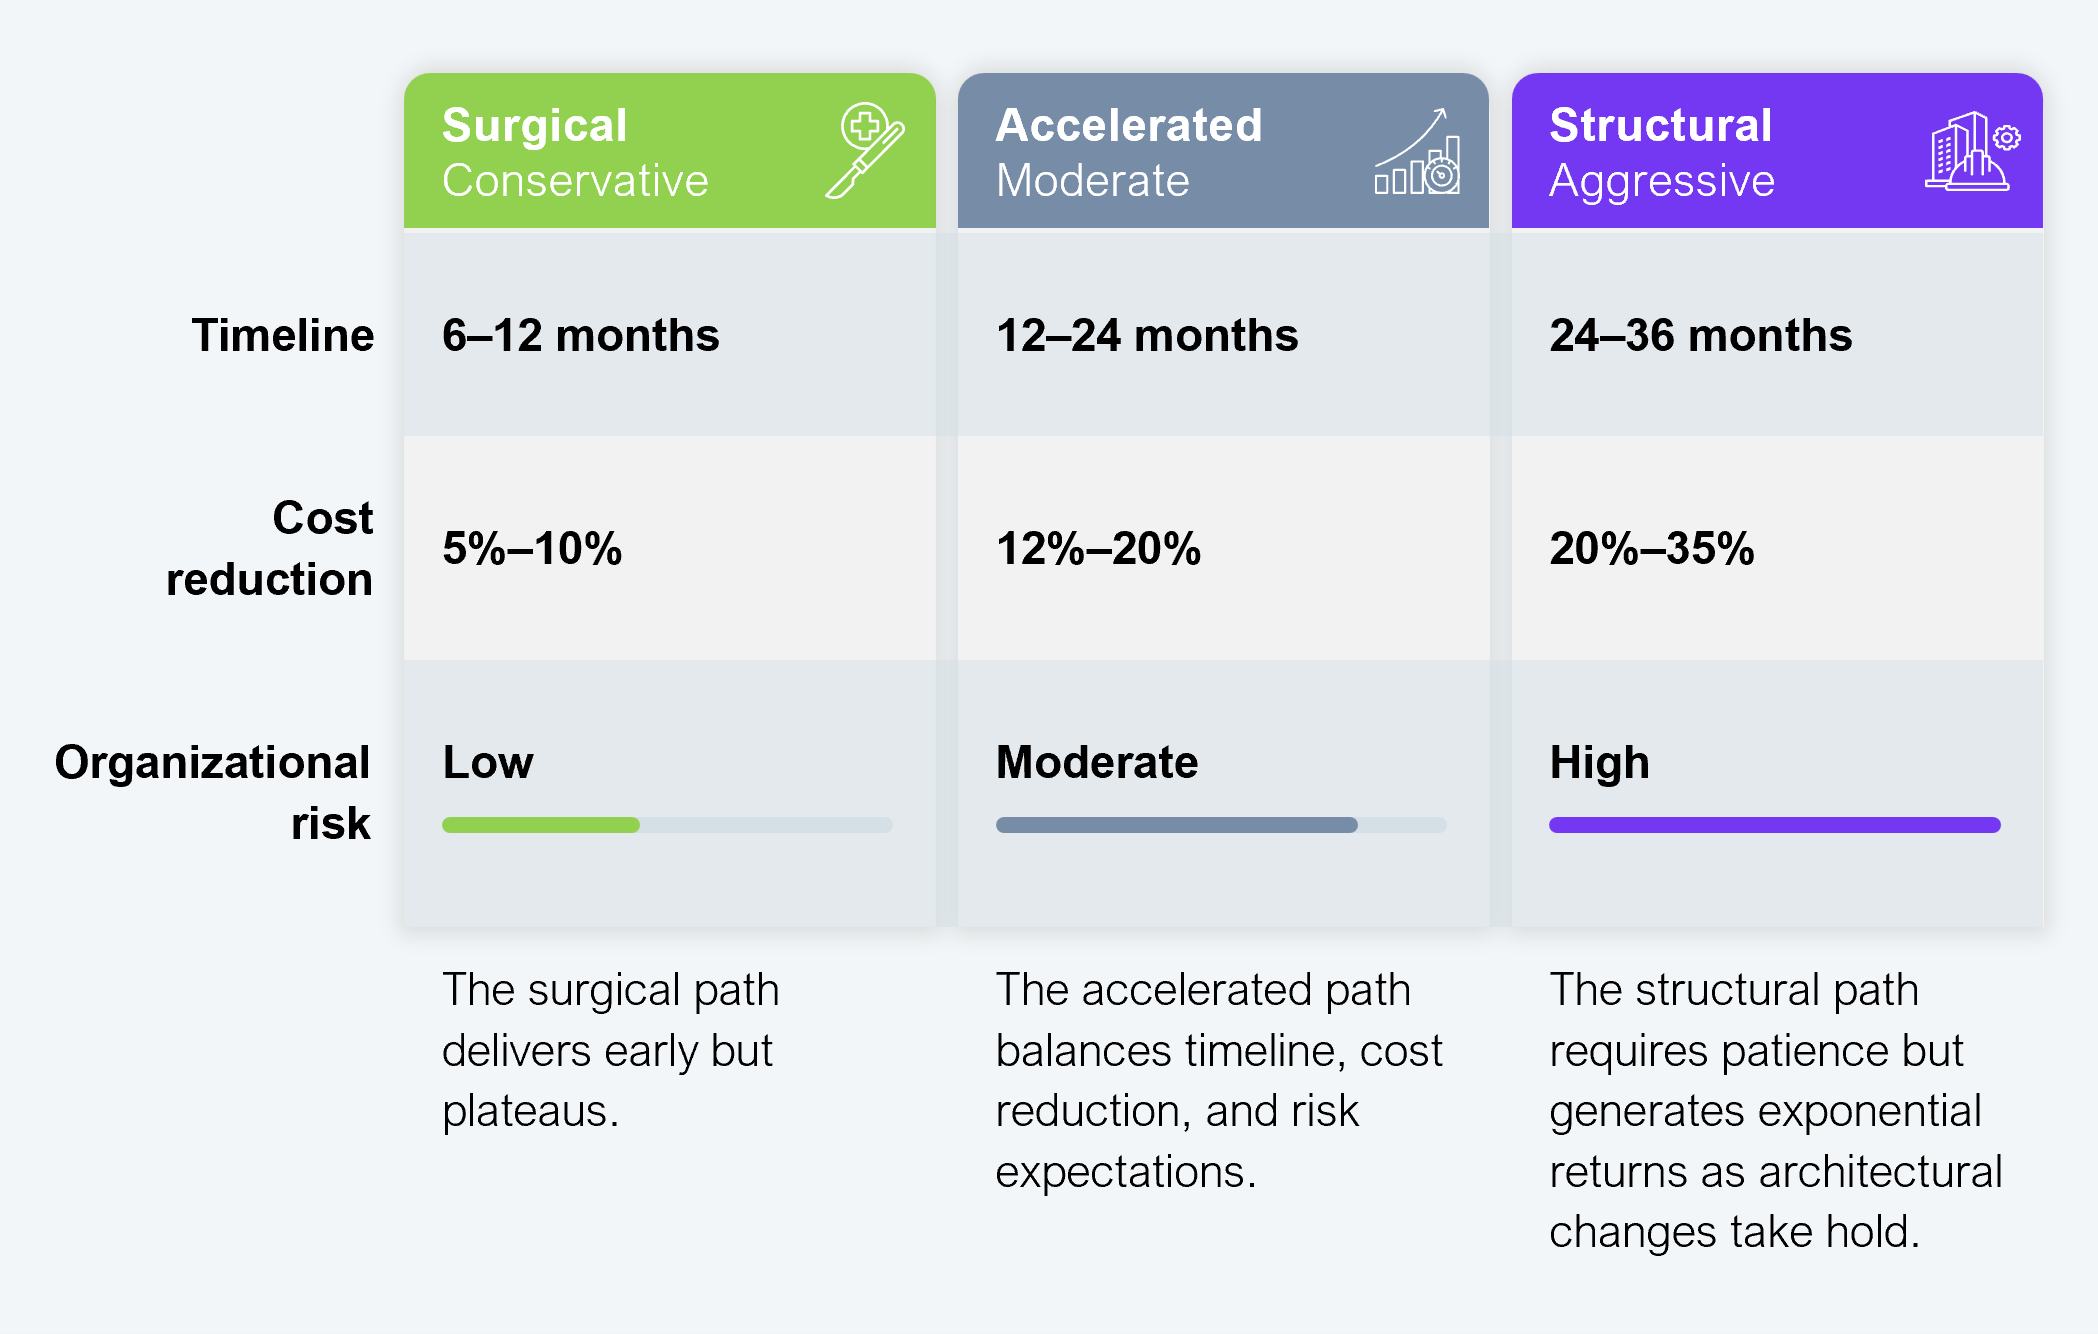
3.1 Select a scenario archetype
The three archetypes in Exhibit 10 represent fundamentally different strategic postures. Select the option that matches your timeline, cost-reduction ambition, and risk parameters. You will sequence the Module 2 levers you chose within this archetype.
Most consumer goods companies with high SKU counts and multi-channel complexity gravitate toward the Accelerated archetype, ambitious enough to deliver material P&L impact within two years but sequenced to avoid disrupting retailer service levels during the transition.
Source: HFS Research, 2026
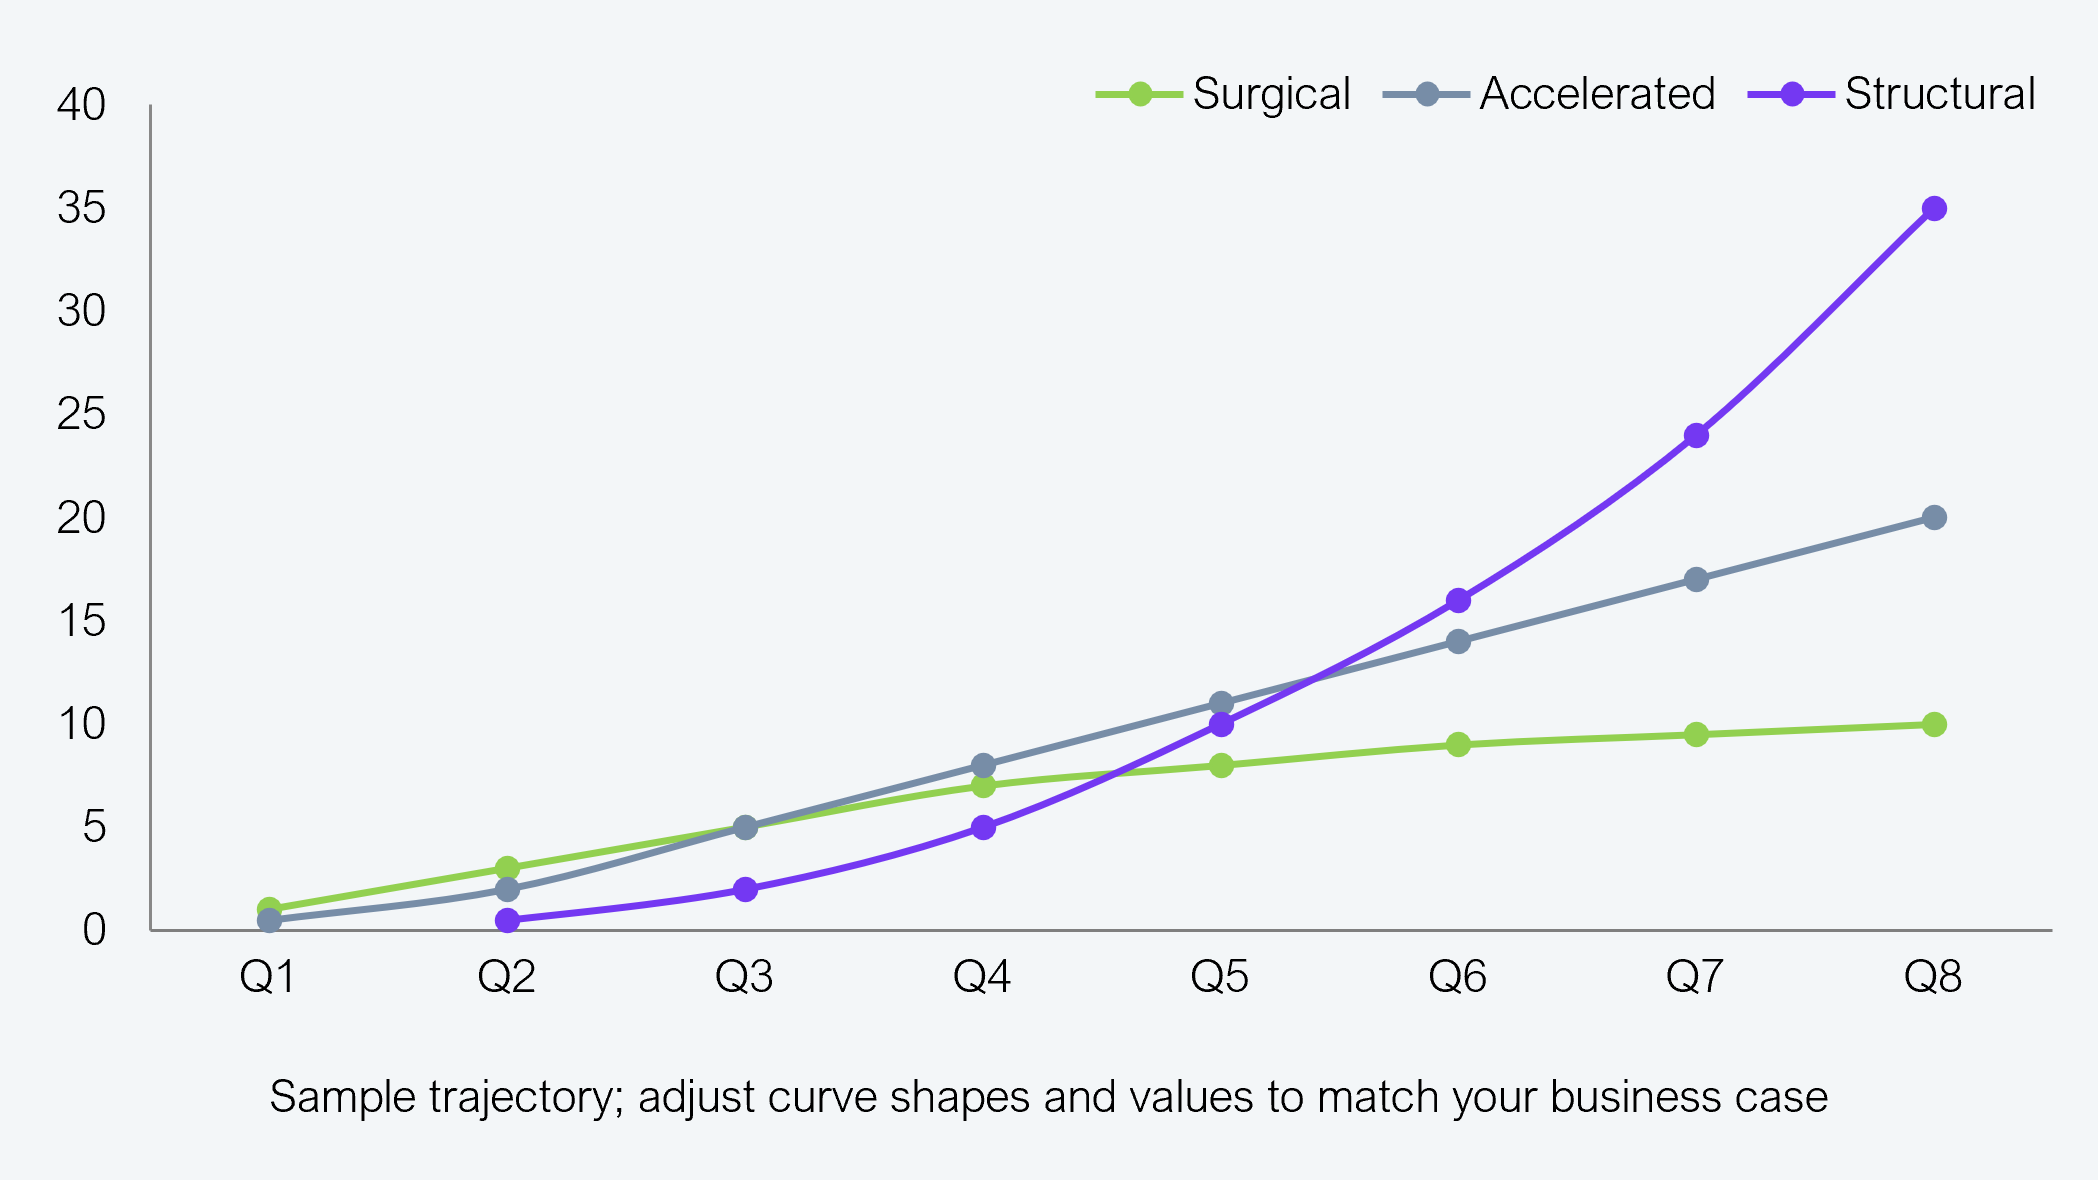
Populate the curves in Exhibit 10 using your Module 1 diagnostic results and Module 2 lever impact estimates.
Use this trajectory to pressure-test your archetype selection. If the Accelerated path shows 15% cumulative reduction by Q6 but your CFO needs 10% within 12 months to sustain board support, validate whether your selected levers can deliver that pace. If not, either swap in a faster lever from Module 2 or reset expectations with the leadership team before building the roadmap. The trajectory also serves as the baseline against which quarterly governance reviews in Module 4 will measure actual progress.
Source: HFS Research, 2026
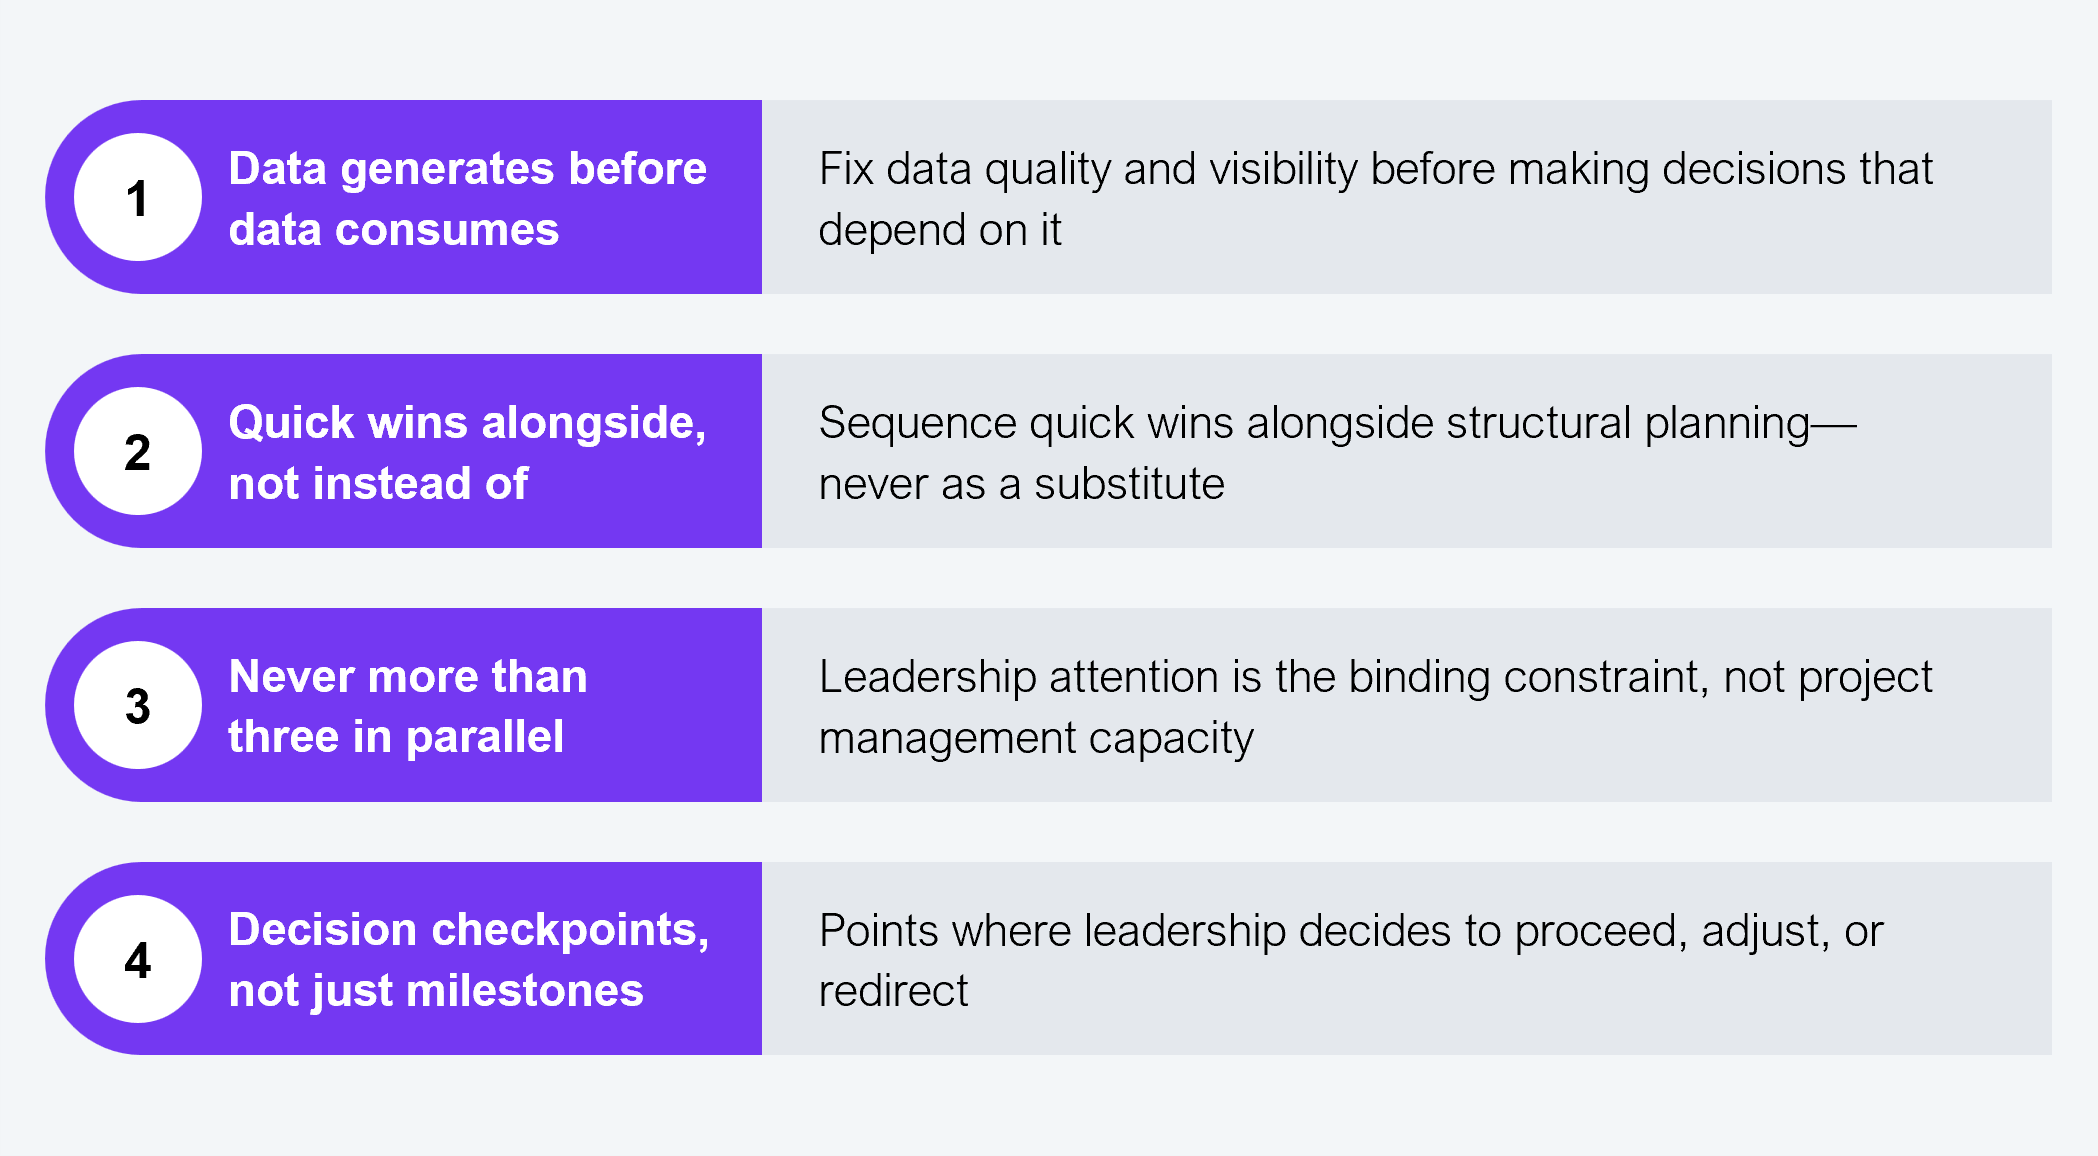
3.2 Apply the four sequencing principles that govern roadmap design
Apply the four sequencing principles to validate your draft roadmap. Check each principle against your plan. Are all data-generating levers scheduled before the levers that depend on their output? Are quick wins running alongside structural work rather than substituting for it? Are you running more than three levers in parallel anywhere on the timeline? Is every checkpoint defined as a decision gate with the four required elements instead of a status milestone? Revise the roadmap until all four principles are satisfied.
Source: HFS Research, 2026
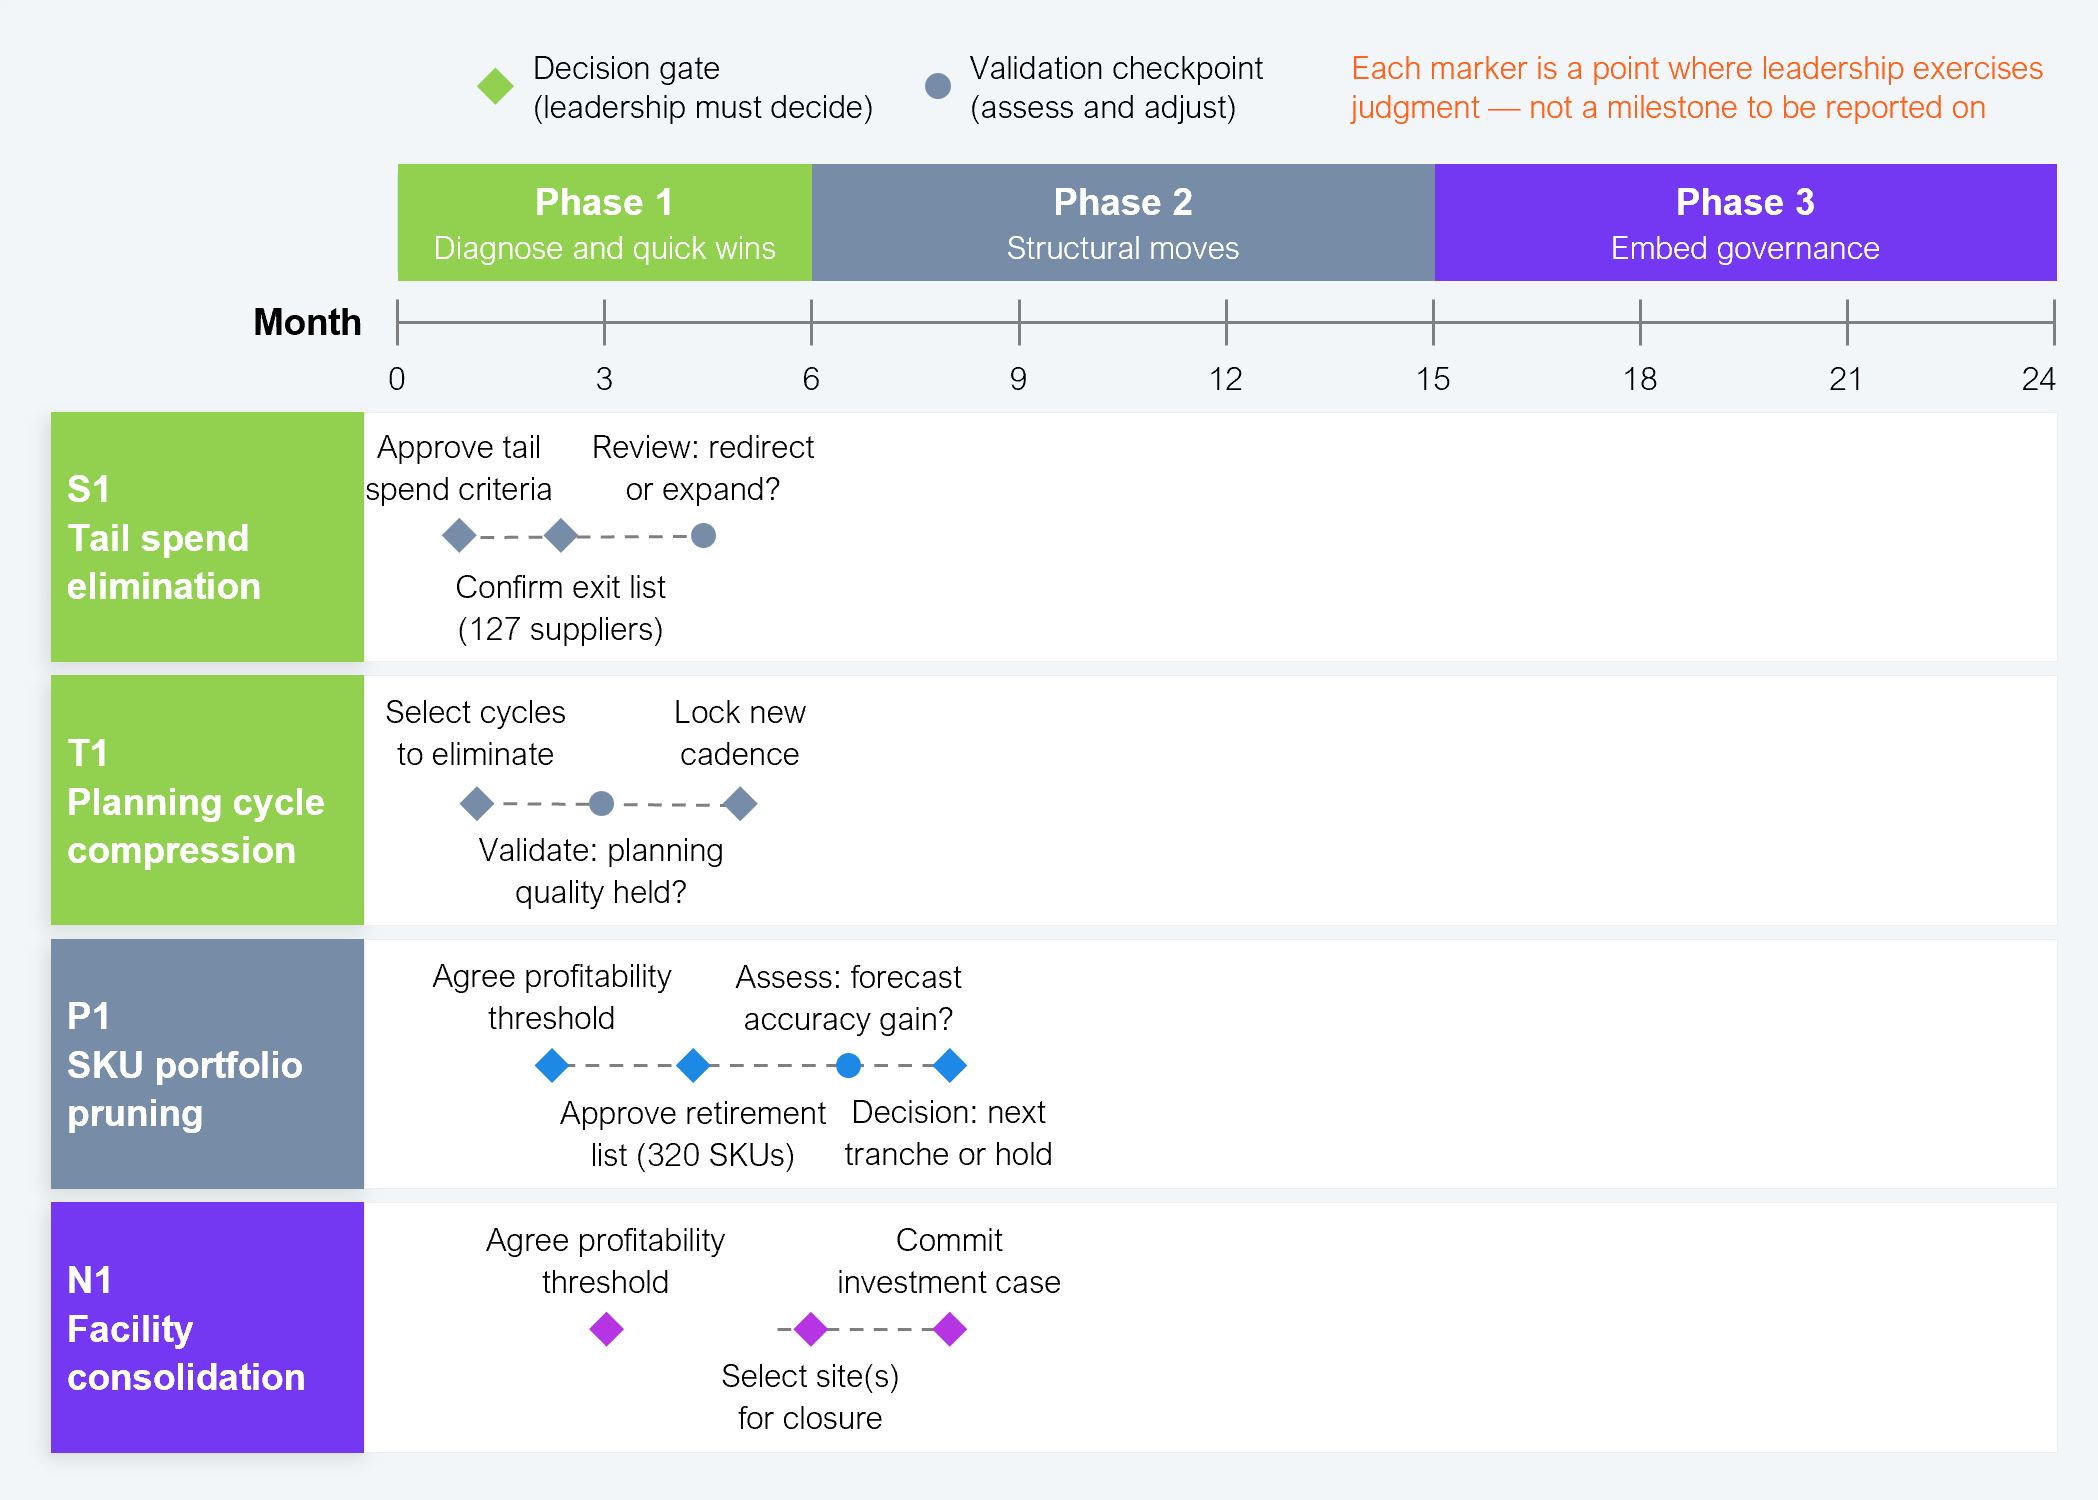
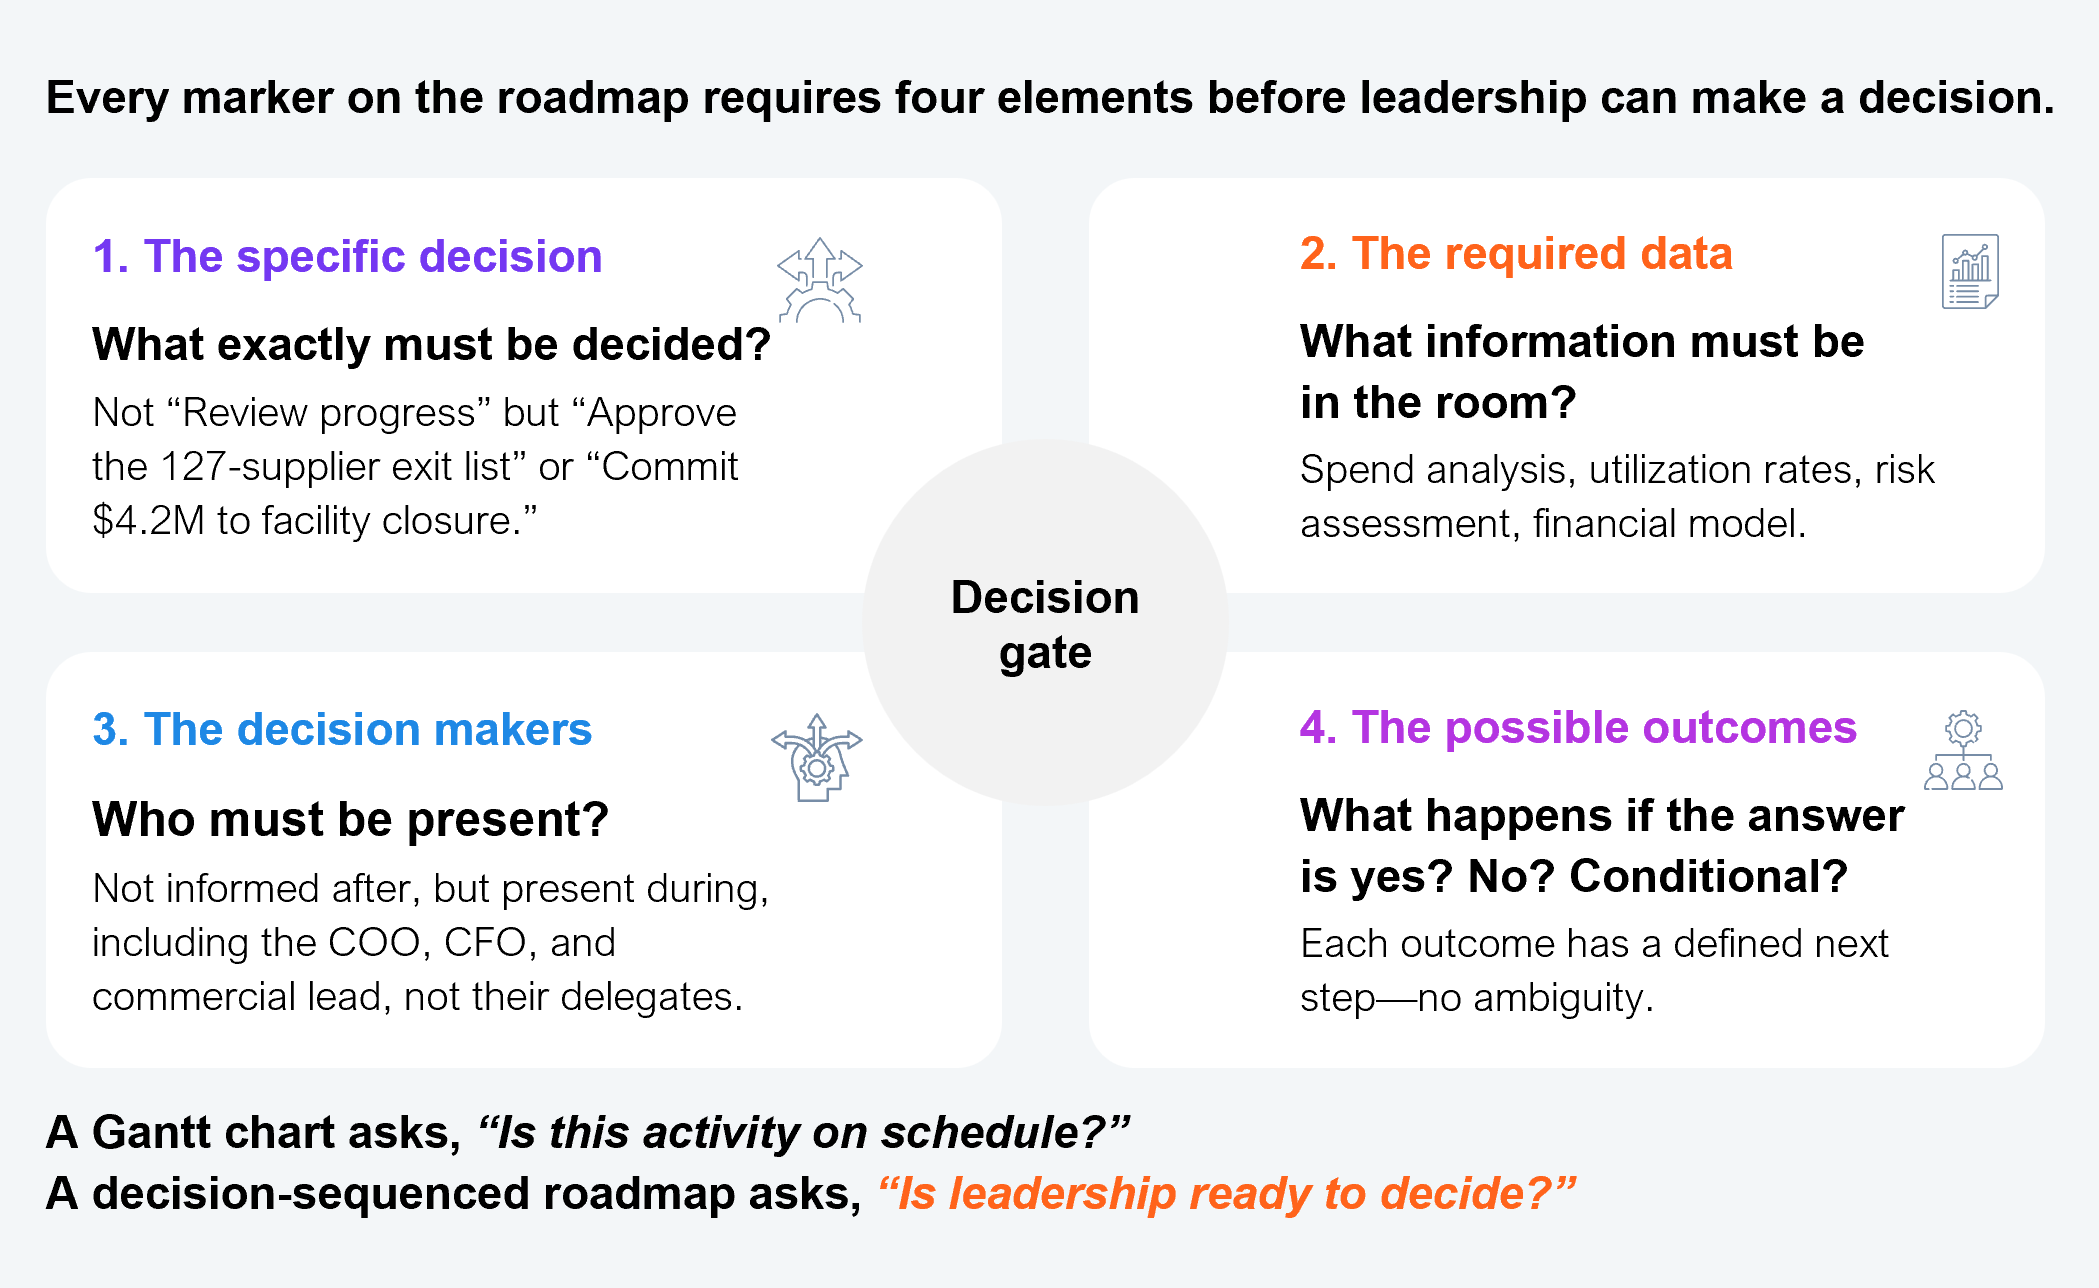
3.3 Build the decision-sequenced roadmap
Build a decision-sequenced roadmap by mapping your selected levers onto the timeline of the archetype you chose. For each lever, define four specific decision gates:
Each gate is a point where leadership exercises judgment, not a milestone to report on.
A decision-sequenced roadmap is fundamentally different from a project plan. It does not track activities, workstreams, or resource allocations. It tracks the points at which leadership must exercise judgment and defines what must be true before each decision can be made.
The roadmap in Exhibit 13 uses illustrative data for the Accelerated archetype. When you build your roadmap, replace the levers, decision gates, and archetype with your choices.
Source: HFS Research, 2026
Every decision gate on the roadmap requires four elements, shown in Exhibit 14. Without all four in place, postpone the gate. A decision meeting missing required data or decision-makers produces worse outcomes than delay.
Start by placing your selected levers on the timeline in the order dictated by the sequencing principles, including data-generating levers before data-consuming levers, and no more than three running in parallel. For each lever, define the decision gates by working backwards from the desired completion date. Identify the dependencies between levers explicitly.
For example, if SKU portfolio pruning (P1) needs to produce forecast accuracy improvements before facility consolidation (N1) can model the reduced footprint, the P1 validation gate must precede the N1 investment gate. Assign a named owner to each gate, not a team or function, but a single individual accountable for ensuring the required data and decision-makers are assembled.
Source: HFS Research, 2026
3.4 Validate the roadmap against organizational capacity
Confirm that no more than three decision gates are scheduled in any given month, that each gate has a named owner, and that the data dependencies between gates are explicit. If the roadmap requires more parallel execution than leadership bandwidth allows, reduce scope or extend the timeline.
The completed roadmap, with its decision gates, owners, and checkpoint dates, becomes the execution backbone that Module 4’s governance architecture is designed to protect.
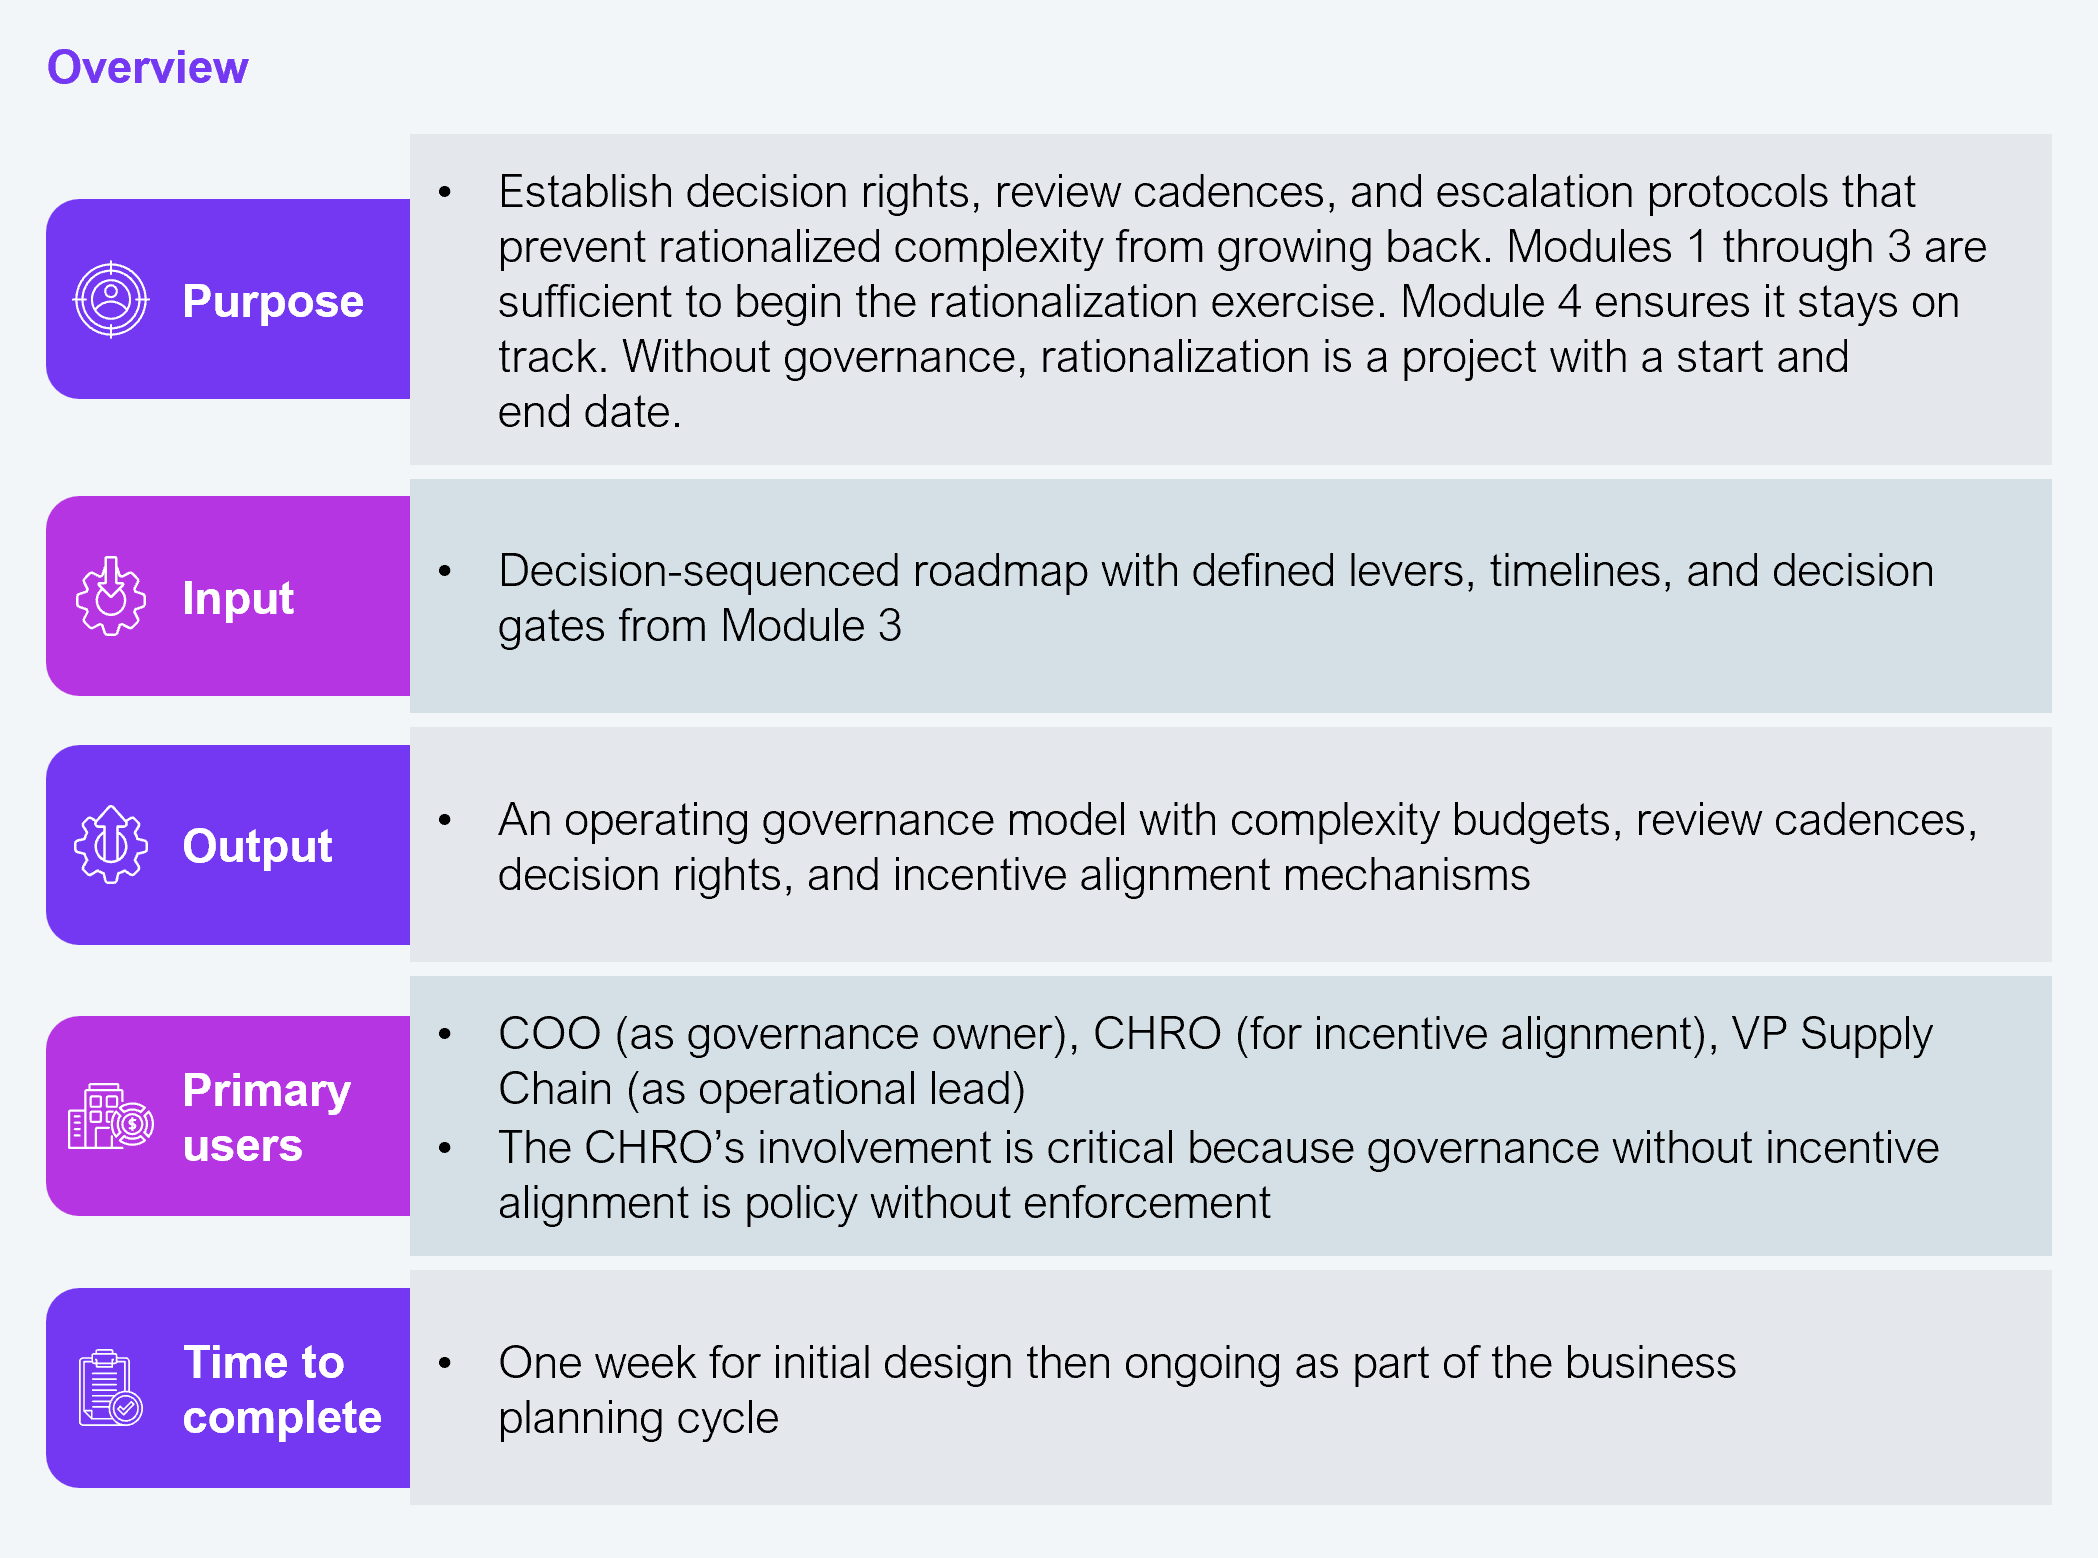
Procedure
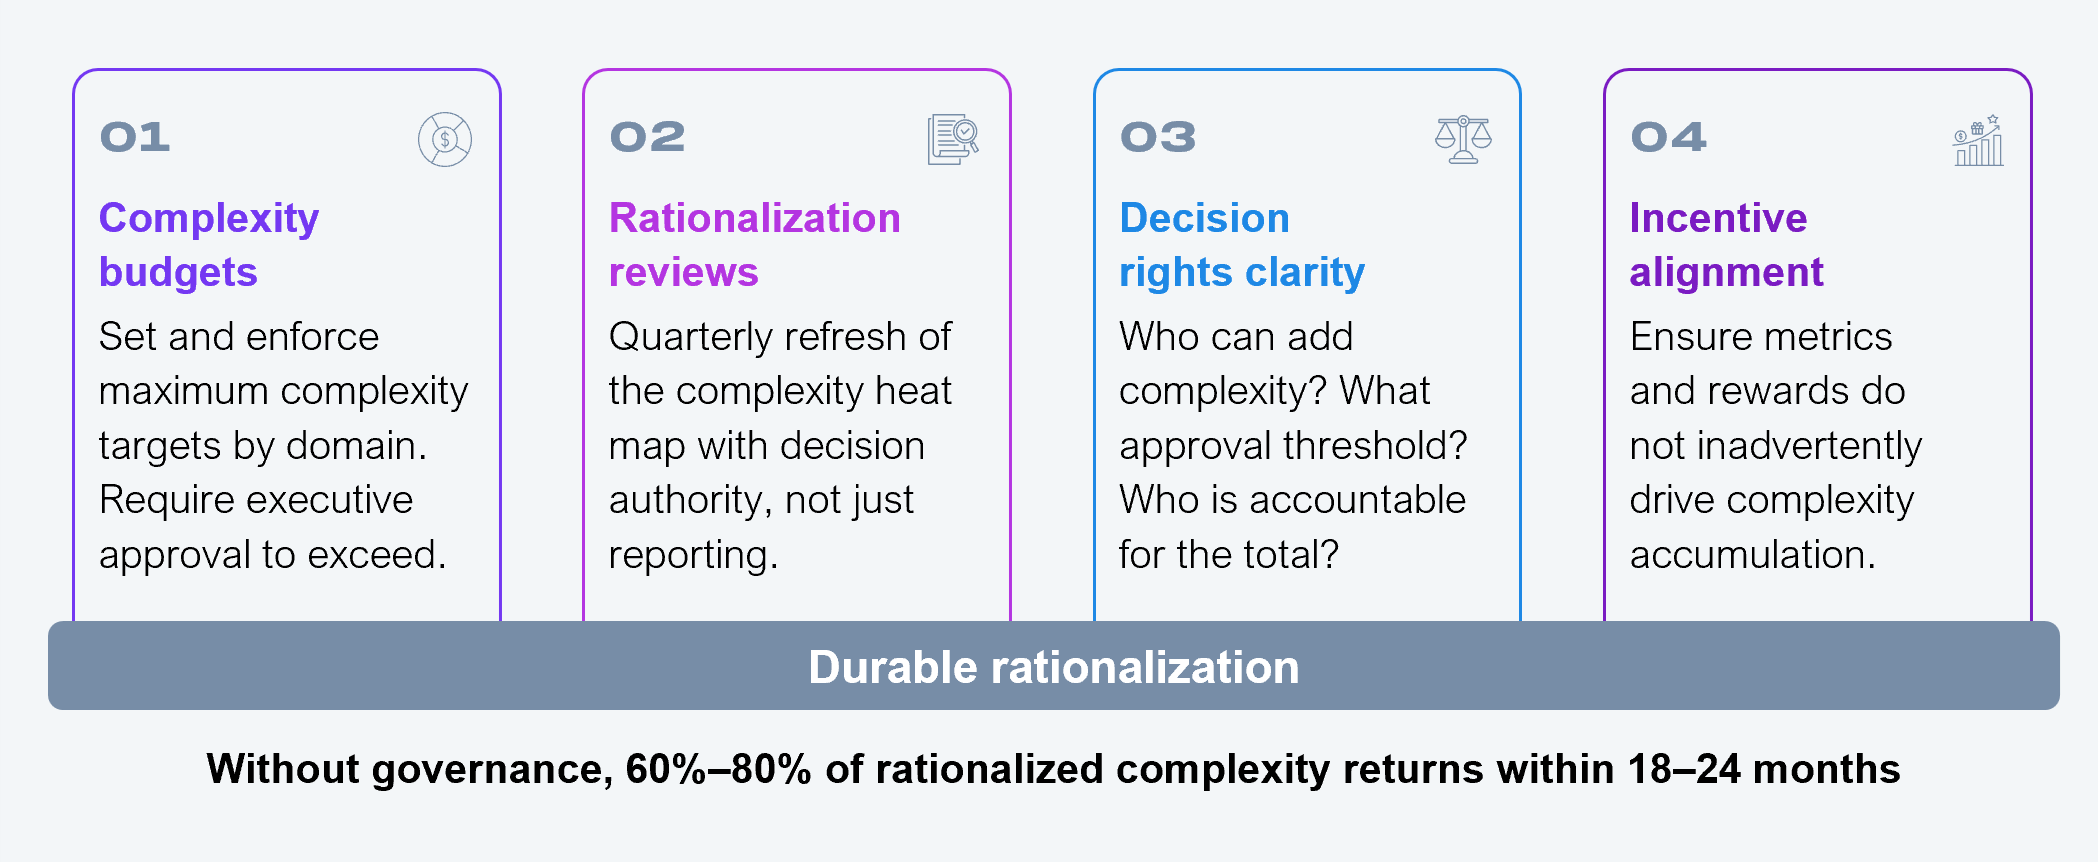
4.1 Set complexity budgets and decision rights
Consumer goods companies that rationalize successfully but fail to embed governance see 60% to 80% of complexity return within 18 to 24 months. Each addition is individually small: a new co-packer for a retailer-exclusive SKU, a line extension launched without a corresponding retirement, a planning tool adopted by one region. Collectively, they reconstitute the complexity that was rationalized. The steps in this module create the mechanisms that prevent this relapse.
Governance begins with defining what “too much” looks like. For each priority domain, set a quantified ceiling: maximum number of active SKUs, maximum number of suppliers per category, maximum number of systems producing demand forecasts. They are hard limits that require executive approval to exceed.
Equally important is specifying decision rights. Who can add complexity to each domain? What approval threshold applies? Who is accountable for the domain’s total complexity score? Without clear decision rights, complexity accumulates through distributed decisions that no single leader oversees.
For each priority domain from Module 1, define a maximum complexity threshold (e.g., active SKU count, supplier count per category, number of planning systems). Specify who can approve additions that exceed the budget and who is accountable for the domain total.
Source: HFS Research, 2026
Pillar 1 (Complexity budgets) sets maximum complexity targets by domain, with executive approval to exceed. Pillar 2 (Rationalization reviews) establishes quarterly reviews with decision authority, not just reporting. Pillar 3 (Decision rights clarity) specifies who can add complexity and who is accountable. Pillar 4 (Incentive alignment) ensures metrics and rewards do not drive complexity accumulation.
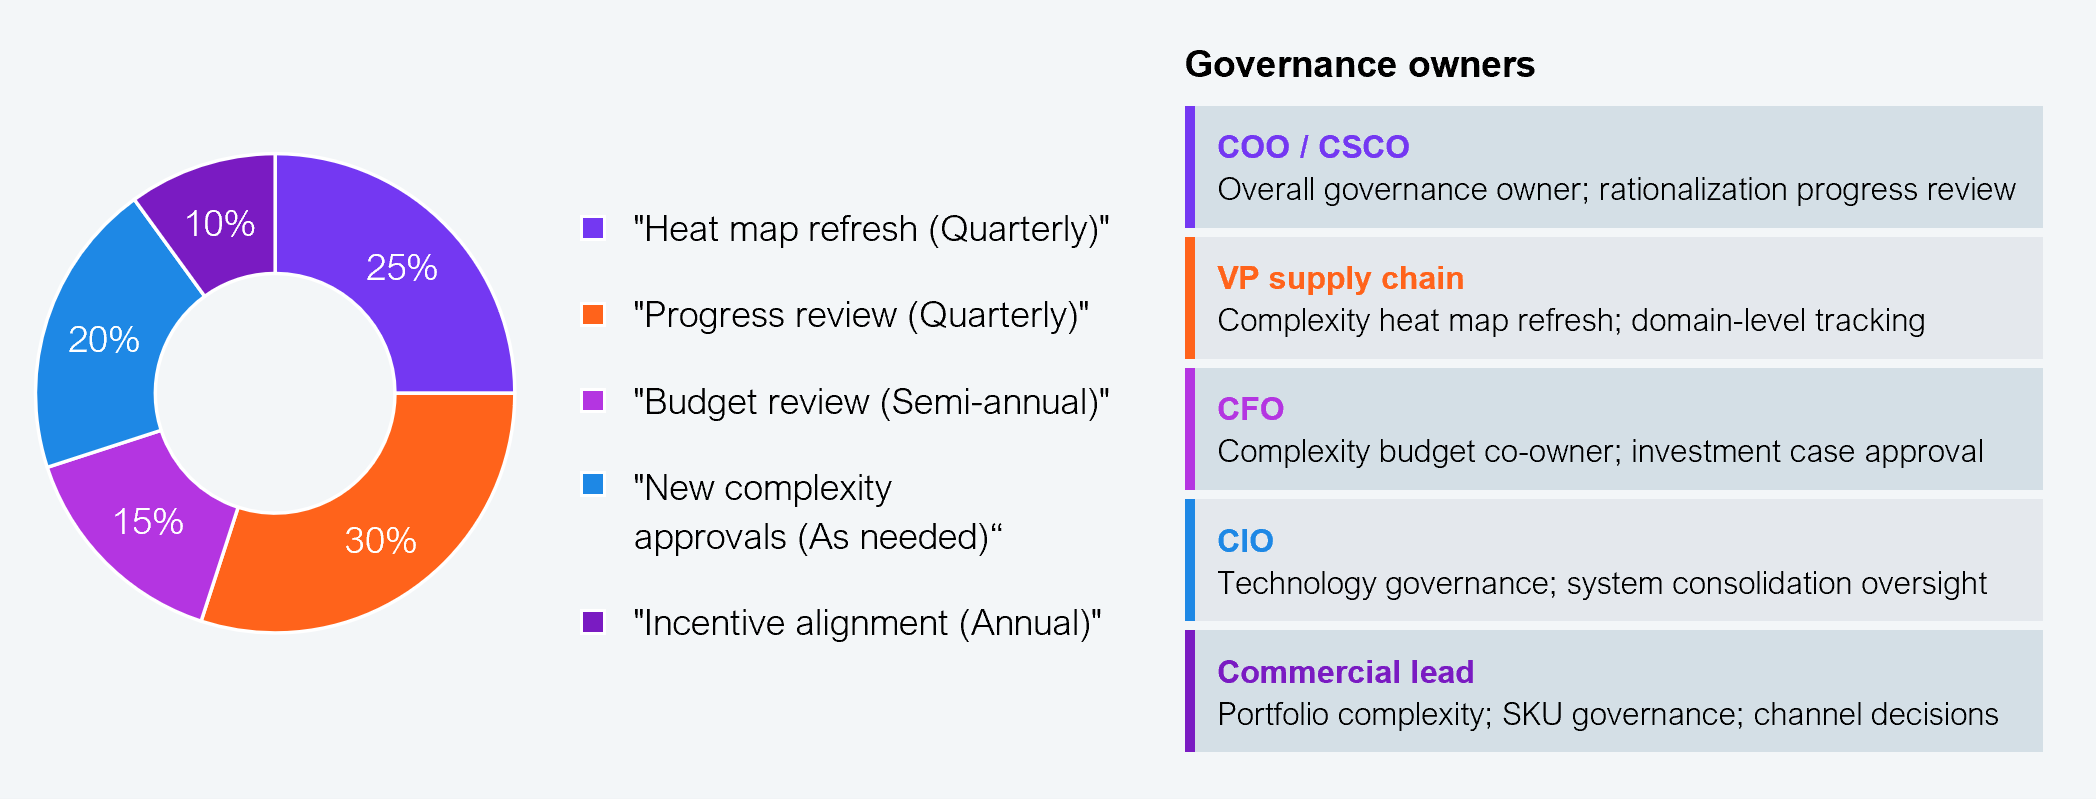
4.2 Establish the review cadence
Embed rationalization reviews into your existing business planning cycle: monthly operational reviews to track whether the roadmap’s decision gates are being met, quarterly strategic reviews to assess whether complexity is trending toward or away from budget, and an annual governance refresh to recalibrate targets.
Governance without a defined operating cadence becomes discretionary, and discretionary governance is no governance at all. The model in Exhibit 16 establishes a rhythm that ties rationalization reviews to the existing business planning cycle rather than creating a parallel governance structure that competes for leadership time.
Monthly operational reviews track whether the roadmap’s decision gates are being met on schedule and whether any gates need to be escalated. Quarterly strategic reviews assess whether domain complexity scores are trending toward or away from budget, and whether any budgets need recalibration. The annual governance refresh recalibrates all budgets, reviews domain targets, and assesses whether the governance model itself needs structural changes.
Source: HFS Research, 2026
4.3 Align incentives
Work with the chief human resource officer (CHRO) to ensure performance metrics and rewards do not drive complexity accumulation. If commercial teams are measured on new product launches without accounting for supply chain cost-to-serve, the governance model will be undermined by the incentive structure.
The most common reason for governance models to fail in the consumer goods industry is the conflict with incentive structures. If commercial teams are rewarded for new product launches, trade spend activation, or shelf space expansion without accounting for the supply chain cost-to-serve of those additions, the governance model will be systematically undermined by the compensation model.
Review current performance scorecards for supply chain, commercial, and category management roles. Identify any metrics that reward volume or complexity additions without offsetting them against cost-to-serve. Collaborate with the CHRO to adjust incentive structures so that rationalization outcomes are measured and rewarded, not just rationalization activities. For example, a category manager’s scorecard should include net SKU impact (launches minus retirements) rather than gross launches alone.
This is the step most organizations skip. It is also the step that determines whether the governance model survives its first test. The first three modules are sufficient to begin the rationalization exercise. Module 4 ensures it stays on track. Without governance, rationalization is a project. With governance, it becomes an operating discipline.
The navigator can be deployed in three ways depending on your organization’s readiness, timeline, and available leadership bandwidth.
Most consumer goods companies in mature markets (North America, Western Europe) will find Modules 1 and 2 partially addressed through prior initiatives and can enter at Module 3. Companies in emerging markets or those that have not conducted a formal complexity assessment should begin at Module 1.
Approach 1
Executive workshop (2–3 days)
This is the fastest path to actionable output and works best when the leadership team can be co-located and the data inputs are already available.
Approach 2
Phased deployment (6–8 weeks)
Sequential two-week modules with data gathering between each phase. Suitable for larger consumer goods companies with complex stakeholder landscapes spanning commercial, category management, trade marketing, and operations functions.
Approach 3
Single-module entry
Any module works standalone. The complexity diagnostic (Module 1) is the most common entry point. Governance to prevent relapse (Module 4) is valuable for organizations that have already rationalized and need to prevent relapse.
The following example follows a single company through all four modules to show how the navigator’s outputs connect. All data in this example is fictional.
Background
Greenfield Consumer Products is a $2.4 billion consumer goods company with 12 brands spanning household cleaning, personal care, and home fragrance. Greenfield sells through mass retail, club, e-commerce, and a growing direct-to-consumer channel across North America. Between 2020 and 2024, Greenfield responded to successive disruptions by adding capacity at every level. By early 2025, it had more supply chain infrastructure than at any point in its history, and worse outcomes. On-time in-full (OTIF) had dropped from 94% to 88%. Gross margin compressed 220 basis points. The CFO summarized: “We spent $160 million building resilience and got complexity instead.”
Module 1: The complexity diagnostic
Greenfield’s COO convened a two-day workshop with the VP Supply Chain, CFO, CIO, VP Commercial, and Head of Trade Marketing. The team scored each complexity domain on the 1–5 heat map. Product/SKU and Network emerged as the two critically overloaded domains. A key insight: 38% of Greenfield’s SKUs generated less than 2% of revenue but consumed a disproportionate share of planning time, warehouse space, and promotional spend.
Module 2: The rationalization lever library
With Product/SKU and Network identified as priorities, the team selected three levers: P1 (SKU Portfolio Pruning), N1 (Facility Consolidation), and N2 (Logistics Simplification). SKU pruning faced commercial resistance around retailer shelf commitments. The team agreed to phase it in two tranches, beginning with SKUs already off promotional calendars.
Module 3: Scenario comparison and sequencing
Greenfield chose the Accelerated archetype—ambitious enough for material P&L impact within two fiscal years, but sequenced to avoid disrupting retailer service levels. The CFO required measurable progress within 12 months to sustain board support. Each cell in the roadmap represented a decision gate with a named owner.
Module 4: Governance to prevent relapse
Greenfield had been through rationalization before. In 2018, they pruned 200 SKUs; by 2020, they had added back 340. This time, governance was non-negotiable. Complexity budgets were set by domain. The governance test came three months in: the VP Commercial requested a 25-SKU retailer-exclusive line for a major club account. Under the new governance, a complexity impact assessment was triggered. The line was approved but reduced to 15 SKUs, with 20 existing low-performers retired simultaneously. The system worked.
This example is illustrative, but the pattern is real. The navigator’s value is in the structured sequence: diagnose before you intervene, select before you sequence, embed governance before you declare victory.
If you don't have an account, Register here |
With the exception of our Horizons reports, most of our research is available for free on our website. Sign up for a free account and start realizing the power of insights now.
Our premium subscription gives enterprise clients access to our complete library of proprietary research, direct access to our industry analysts, and other benefits.
Contact us at [email protected] for more information on premium access.