This HFS Point of View argues that application management services (AMS) contracts priced on effort and governed by service-level agreement (SLA) dashboards are obsolete and that CIOs must adopt a four-metric framework (productivity, prediction, personalization, and performance) to capture value in the $1.5 trillion Services-as-Software™ era.
Seventy-five percent (75%) of enterprises want to renegotiate their IT services contracts, up from 40% in 2020. It didn’t almost double because CIOs suddenly got better at procurement; it doubled because the limitations of the current model got exposed.
Application management services, the $200 billion-plus backbone of enterprise IT operations, is still priced on effort, governed by watermelon SLAs, and delivered through human-intensive L1 and L2 layers designed for the offshoring era. Meanwhile, AI agents resolve incidents autonomously, platform vendors embed self-healing capabilities into their Software-as-a-Service (SaaS) products, and a new $1.5 trillion market category, Services-as-Software™ (SAS), is capturing revenue from both traditional IT services and software. If you are a CIO, every renewal based on old terms makes your eventual transformation harder and more expensive.
For 25 years, IT services created value through labor arbitrage: offshore to India, layer on robotic process automation, standardize on ITIL (information technology infrastructure library), and squeeze 5%–10% annually. It worked beautifully, and it built a $1.5 trillion industry. However, in 2026, the labor arbitrage model had passed its shelf life. The productivity gains available from labor arbitrage have been fully extracted. Every enterprise of meaningful scale has already offshored, already automated the automatable, and already optimized what Six Sigma can touch.
The new value curve, powered by GenAI and agentic AI, promises 30%–70% productivity gains beyond what labor delivered. But the nature of value is different. On the old curve, you did the same things cheaper. On the new curve, you do fundamentally different things. Your AMS doesn’t just resolve incidents faster; it prevents them from being created. Your integration layer doesn’t just move data; it self-heals when a handoff breaks. Your monitoring doesn’t just detect anomalies; it simulates failures on digital twins before they happen in production.
The traditional AMS value proposition has been a single-P story: productivity. Essentially, resolve tickets faster, reduce headcount, and drive down cost per incident. It is a defensible story, but a dangerously incomplete one.
The framework that replaces it has four dimensions. Productivity still matters, but it is joined by prediction (shifting from break-fix to predict-prevent across value streams), personalization (tailoring the operational experience by persona, so a field sales rep and a plant manager get fundamentally different service), and performance (measuring business outcomes like order fulfillment, revenue continuity, and supply chain velocity, not just mean-time-to-resolution [MTTR] and uptime).
HFS analysis of 979 real-world AI use cases reveals a pattern that should alarm every CIO still pitching AI as a cost play. In pilot programs, 54% of use cases target productivity. Only 8% target performance. But in production deployments, the mix inverts: productivity drops to 19%, while prediction rises to 29%, personalization to 25%, and performance to 27% (Exhibit 1). The enterprises that framed AI as “fewer FTEs” are stuck in pilots. The ones pursuing prediction, personalization, and business performance broke through—same technology but a completely different organizational trajectory.
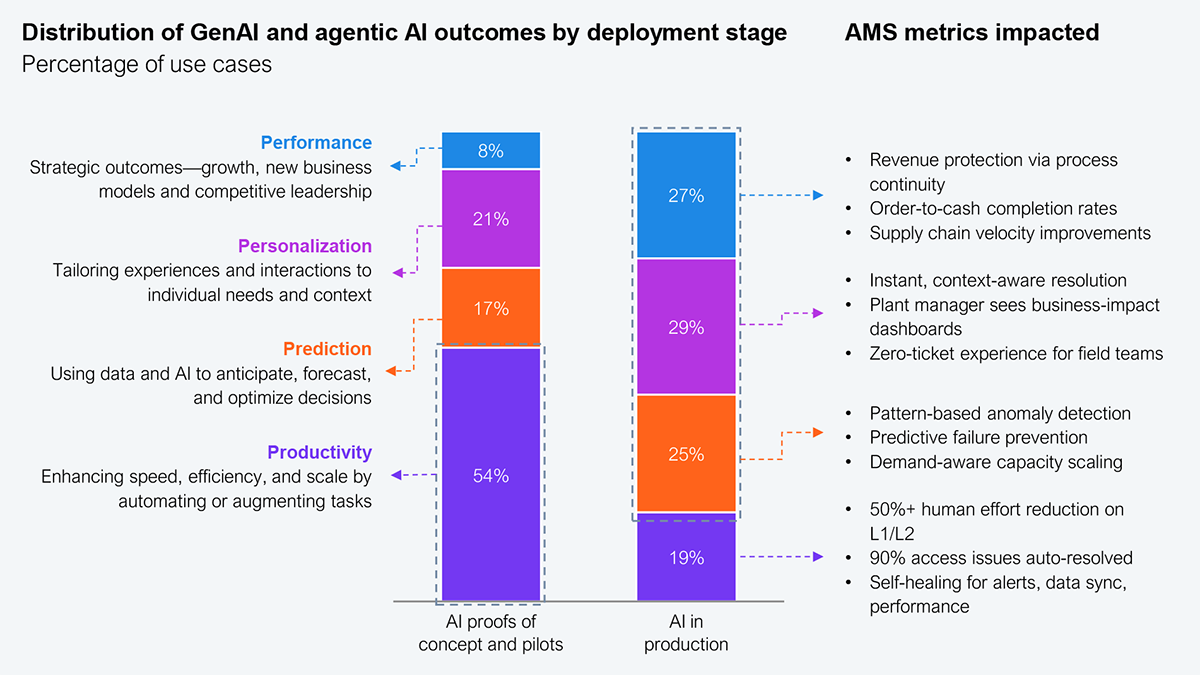
Sample: 979 GenAI and Agentic AI use cases collected by HFS over the last 12 months
Source: HFS Research, 2026
In a recent HFS-facilitated innovation workshop with a major CPG enterprise and its primary AMS provider, both parties independently arrived at this same 4P framework. When two independent analyses converge on the same structure, the market is telling you something. The enterprise in question didn’t just adopt the 4Ps as an analytical tool. It adopted the metrics focus as the operating language for its next-generation AMS relationship.
The CIO who walks into a board meeting and says, “We reduced L1 tickets by 40%” can get an affirmative nod. However, the CIO who says, “We reduced order-to-cash cycle failures by 60%, enabled $12 million in working capital unlock, and our field sales team hasn’t experienced an IT-related disruption in 90 days” can get a seat at the strategy table. It’s the same AI, but in a different frame and with an entirely different organizational consequence.
Here’s an architectural problem we need to talk about. In AMS, value doesn’t live inside any single application. It lives in the handoffs between them. A typical order-to-cash flow in a large CPG enterprise touches at least seven systems across more than 20 application handoffs. Each system has its own monitoring, service-level agreements (SLAs), and support team. If a middleware handoff between SAP and the logistics engine fails at 2 a.m., nobody owns that gap. Every individual SLA is green, but the end-to-end business outcome is red. This is what HFS calls the watermelon SLA: green on the outside, red on the inside.
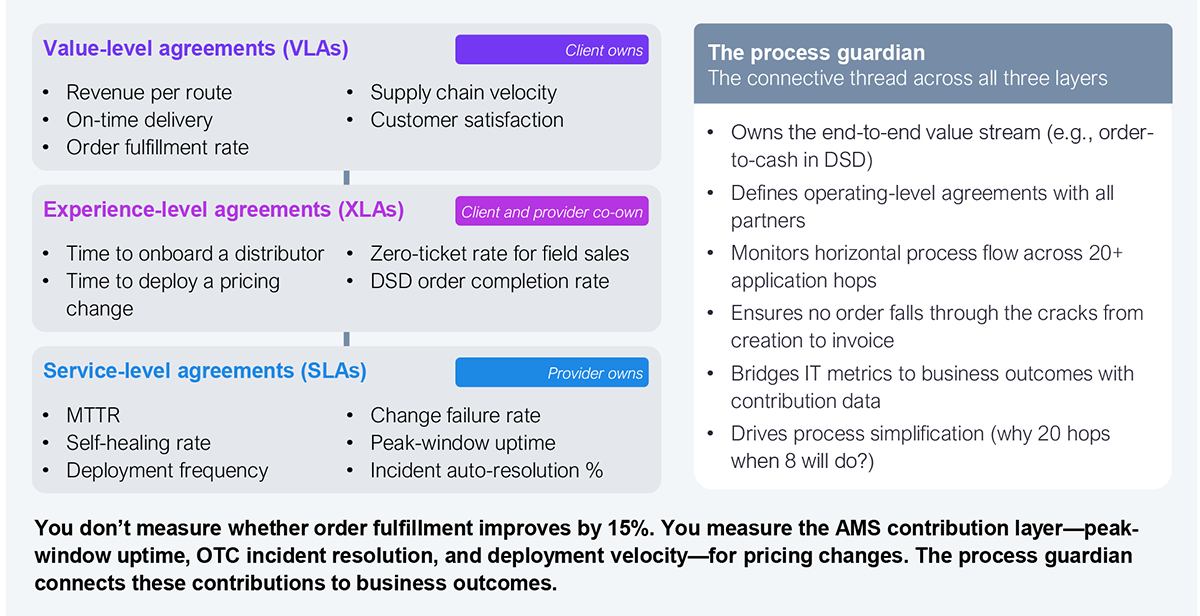
The fix is a role we call the process guardian, a horizontal accountability layer that owns the end-to-end value stream, not the vertical application stacks. The process guardian monitors every handoff, identifies where failures originate (almost always upstream of where they surface), and drives simplification across functional boundaries. In the CPG workshop, the question arose naturally, “If we align AMS to business KPIs, how does accountability work when IT doesn’t fully control those KPIs?”
The answer is a three-tier model. Value-level agreements (VLAs), such as revenue per route and on-time delivery, remain the enterprise’s to own. Experience-level agreements (XLAs), such as time to deploy a pricing change and zero-ticket rate for field teams, are co-owned by the enterprise and the provider. SLAs, MTTR, self-healing rate, and deployment frequency remain the provider’s to own entirely (Exhibit 2). The process guardian is the connective tissue that makes the contributions of SLAs and VLAs visible, measurable, and defensible.
Source: HFS Research, 2026
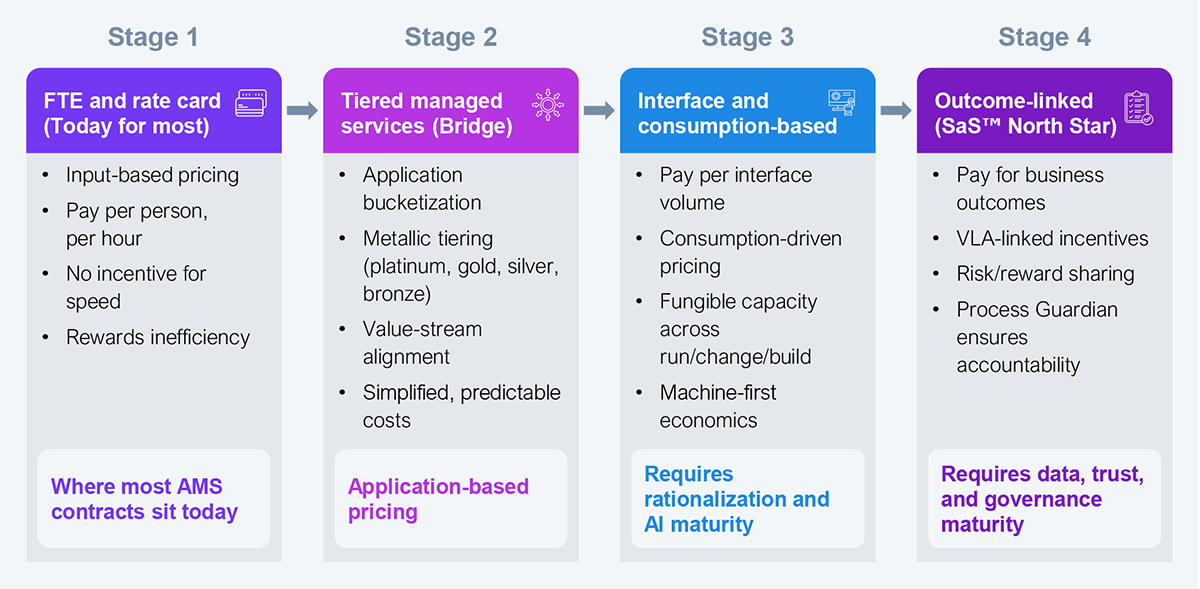
The end state of AI-centric engagement is a commercial model that pays for business results, but the path there has four stages, and each one builds the foundation the next one requires. Even with the right framework and the right operating model, transformation stalls if the commercial structure belongs to a different era. Measuring AI-led services in “FTE equivalents” is like measuring streaming bandwidth in DVDs shipped. That unit of measurement has expired. For an AI-first AMS contract, you require a commercial model that rewards outcomes rather than effort.
Source: HFS Research, 2026
Rate cards (today’s default) reward inefficiency. Tiered managed services (the right bridge) introduce differentiation by business criticality. Consumption-based pricing (the next horizon) automatically adjusts as automation increases. Outcome-linked pricing (the North Star) pays for business results instead of effort. You should know your destination from the first step. Contracts that lack a designed progression from stage two to stage three are not “phased transformations.” They are an optimization of the status quo with better typography on the SOW.
The enterprises that sequence correctly, simplify before they automate, measure across value streams before they optimize individual applications, and redesign their commercial structures before they renegotiate rates, will define the next generation of AMS models.
Register now for immediate access of HFS' research, data and forward looking trends.
Get StartedIf you don't have an account, Register here |
With the exception of our Horizons reports, most of our research is available for free on our website. Sign up for a free account and start realizing the power of insights now.
Our premium subscription gives enterprise clients access to our complete library of proprietary research, direct access to our industry analysts, and other benefits.
Contact us at [email protected] for more information on premium access.